I Underwrote The Wave For 2024. It Showed Up In 2026.
I was one of the operators who underwrote the assumption the wave would arrive in 2024.
It didn't.
I sat through 2024 expecting the forced sales to start. I sat through most of 2025 watching debt funds extend, modify, and quietly recap the deals that should have been hitting the market. I told investors the wave was coming. I told myself the wave was coming. I built underwriting assumptions around a buying window that kept getting pushed to next quarter, then the quarter after, then the quarter after that.
By the end of 2025 I had mostly stopped saying it.
The operators I respect had mostly stopped saying it too.
The phrase "extend and pretend" became the default explanation. Debt funds were not going to crystallize losses on their books if they could avoid it. Sponsors who should have been forced sellers were being given workout terms instead of foreclosure notices. The wave, the one operators had been promised since 2023, was not arriving on the timeline anyone had built into a model.
And then in Q1 and Q2 of this year, it did.
TL;DR
The distressed apartment wave that operators waited on through 2023, 2024, and most of 2025 actually started transacting in Q1 and Q2 2026. The lag was real, the wait broke a lot of underwriting assumptions, and the operators who are buying now are looking at a window that is materially different than the one anyone modeled two years ago. This is the operator confession, the diagnostic on what changed, and the read on where the wave is actually concentrating.
I. The Confession
I want to start with the part most operator-facing content skips.
I was wrong about the timing.
Not wrong about the mechanic. The 2021 and 2022 vintage had structural problems. The floating-rate paper was always going to hit a wall. The rent growth assumptions in those underwriting models were never going to hold up. All of that was readable in 2023.
What I missed was the patience of the debt side.
The debt funds, the bridge lenders, the senior lenders sitting on the floating-rate paper had every incentive to extend rather than foreclose. Foreclosure crystallizes a loss. Extension keeps the loan on the books at par. For a debt fund that doesn't want to mark down its book in front of its own investors, extension is the rational move every quarter until it isn't.
For two years it kept being the rational move.
I built underwriting assumptions around a wave that the debt side had every reason to delay, and I underestimated how long they would delay it. That cost me deals I would have done if I had been more patient about the timing. It also cost me credibility with a couple of allocators who heard the "wave is coming" narrative from me in 2023 and watched the wave not arrive.
I am writing this piece partly because I think most operators owe the same confession and almost none of us have written it.
I was wrong about the timing, not the mechanic. The 2021–2022 vintage always had structural problems. What I missed was how long the debt side would choose extension over foreclosure.
— Andrew LeBaron
II. What Actually Changed In Q1 2026
The wave didn't arrive because operators got smarter. It arrived because the math on the debt side flipped.
Three things moved between late 2025 and Q1 2026.
The extension capacity ran out. Debt funds that had extended floating-rate deals once, twice, sometimes three times, hit the structural limit of how many times the same loan could be modified without triggering accounting or investor-disclosure consequences. The extension well dried up.
The replacement capital got more expensive. The bridge-to-bridge refinance market that had been the escape valve for sponsors with maturing paper in 2024 essentially closed. The new bridge debt available in early 2026 came with terms that made workouts look better than refinancings.
The dispersion inside the debt funds widened. The funds that had been "extending and pretending" started sorting their books. The deals with a credible path to recovery kept getting extended. The deals without one started moving toward sale. That sorting is what actually produced the Q1 transaction volume.
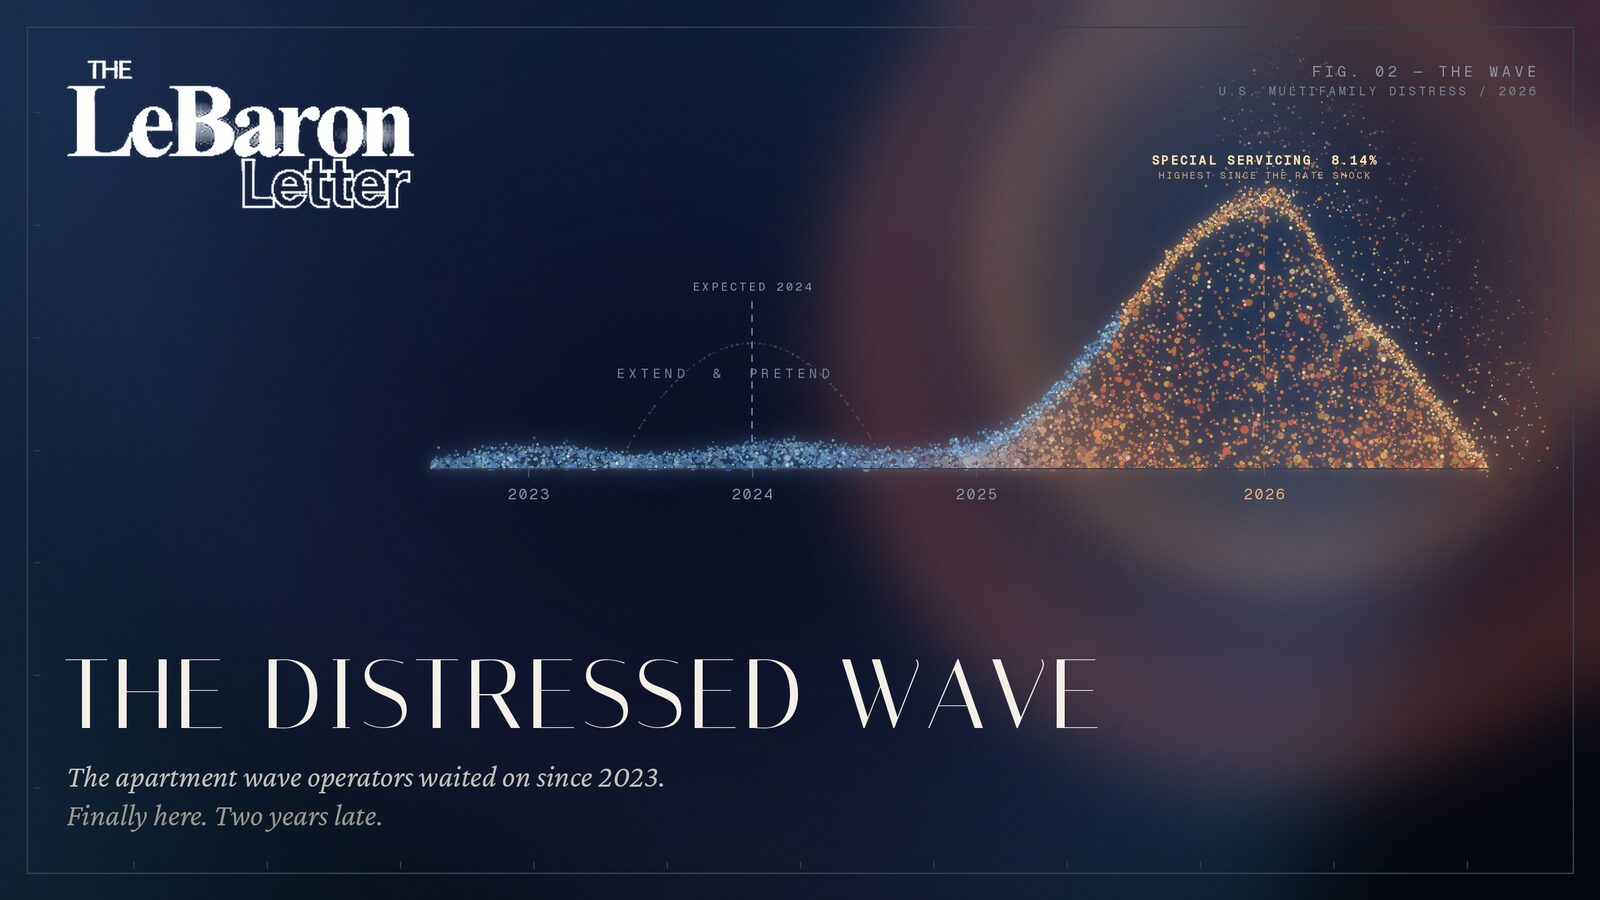
Trepp's overall CMBS special servicing rate climbed 27 basis points in March to 11.00% by the April report — the highest reading in more than a year — with multifamily special servicing pushing past 8% (it was 8.14% in January). That number is not just a stress indicator. It is the operational measure of how many loans moved out of "extend" into "work out." The mechanism that had been holding the wave back finally rolled over.
The Multi-Housing News piece from April 8 has the analyst version of this story — roughly $806 billion of multifamily debt maturing by 2028 and values down about 28% from their 2022 peak. The operators I have been talking to in the last 90 days have the on-the-ground version. They are the same story.
III. Where The Wave Is Actually Concentrating
The wave is not evenly distributed across the apartment market. It is concentrated in three places, and the operators buying right now are mostly buying inside those three pockets.
Floating-rate paper originated in 2021 and 2022. This is the largest concentration by a wide margin. Deals underwritten at near-zero rates, with rate caps that have expired or are about to, in markets where the rent growth assumptions never materialized. Most of the transactional distress in Q1 was here.
Supply-saturated Sun Belt submarkets. The metros that absorbed the most new construction during the 2021 and 2022 development boom are the same metros where operating performance underran the underwriting most badly. Phoenix, Austin, parts of Atlanta, parts of central Florida. The wave is concentrated inside specific submarkets within those metros, not evenly across them.
Class B value-add deals that didn't complete the value-add. A meaningful share of the distress is on deals where the sponsor raised capital to renovate units and reposition the property, then stopped the renovation when costs ran over and rents flattened. Those deals are sitting in a partial-execution state that makes them hard to refinance and harder to sell, which is why they are showing up in the workout pipeline now.
The institutional capital is reading this concentration correctly. Neighborhood Ventures launched a $25 million Opportunistic Fund II in January specifically targeting 30%+ discounts across 5–8 distressed assets. Heitman closed its $2 billion Value Partners Fund VI in the same window — the firm's largest closed-end fundraise ever. Multiple debt funds have launched dedicated workout vehicles. The product is being built for the wave that is now actually transacting.
The wave isn't evenly distributed. It's concentrated in floating-rate 2021–2022 paper, a handful of oversupplied Sun Belt submarkets, and half-finished Class B value-add deals. Underwrite the pocket, not the headline.
— Andrew LeBaron
IV. The Mistake I See Most Operators Making Now
Here is the part where the underwriting most needs to change.
The operators I see making the most expensive mistake in 2026 are the ones underwriting the wave the same way they would have in 2023.
In 2023 the assumption was that distressed deals would clear at deep discounts because supply of distressed paper would overwhelm demand. The actual 2026 wave is clearing at meaningful discounts, but not panic discounts, because the buying side is more disciplined and better-capitalized than the 2023 model anticipated.
The operators showing up at the table now are not the same operators who were promising investors distressed-deal fund returns in 2023. The ones who survived the wait are more conservative. The ones who joined the conversation in late 2025 came in with institutional capital and institutional underwriting. The bidding is competitive on the deals that are actually clean, and the deals that are not clean are not clearing at any price because the underwriting risk is too concentrated.
The implication for an operator looking at this market today:
The 30% discount that Neighborhood Ventures is targeting is a real number, and it is also the floor for the cleanest deals. The deals with capital stack issues, governance issues, or unfinished value-add are clearing further below that, but they come with execution risk that most operators are systematically underpricing.
The buying window is real. It is also more selective than the 2023 narrative predicted.
V. The Three Things I'm Doing Differently This Time
Since I owe the confession, I owe the recalibration too.
I'm underwriting the debt side first. Before I look at the asset, I am reading the loan documents, the rate cap status, the workout history, and the special servicer's posture. The asset is the second underwrite. The debt situation is the first.
I'm sizing for execution risk, not just basis. A deal at a 35% discount with a half-finished value-add and a fractured capital stack is not a cheaper version of the same deal at a 25% discount with cleaner documentation. The execution premium is the variable. I am pricing it in.
I'm being patient about the right type of deal, not the right type of market. Two years of waiting for the wave taught me that "the market" was the wrong unit of analysis. The right unit is the specific deal, the specific debt situation, the specific submarket. The patience I have left in me is going to the operators and deals that fit my actual underwriting, not to a market-level forecast that already cost me two years.
VI. The Read I Keep Coming Back To
The wave finally arrived. It arrived two years later than most of us said it would, in a different shape than most of us modeled, with a more disciplined buying side than most of us expected, and at discounts that are real but not panic.
The operators who are going to do well in this window are the ones who can hold two things in their head at once.
The window is real, and the wait broke a lot of underwriting assumptions.
Distressed paper is finally moving, and the buying side has more capital and more patience than the 2023 narrative predicted.
The 30% discount is the floor, and the execution risk inside the deals below that floor is the variable most operators are mispricing.
The wave isn't the trade. The selection inside the wave is the trade.
I waited two years to write that sentence. I want to be honest about the waiting because the waiting was the actual lesson. The deals are here now. The discipline the wait imposed is the only reason I trust my own underwriting on them today.
If you're looking at the distressed apartment market right now and trying to figure out which deals inside the wave are actually underwriteable, I keep 30 minutes a week open for conversations like that. No pitch. Just the read. Book a meeting with me here.
— Andrew
The 30% discount is the floor, and the execution risk inside the deals below that floor is the variable most operators are mispricing. The wave isn't the trade. The selection inside the wave is the trade.
— Andrew LeBaron
I Underwrote The Wave For 2024. It Showed Up In 2026.
I was one of the operators who underwrote the assumption the wave would arrive in 2024.
It didn't.
I sat through 2024 expecting the forced sales to start. I sat through most of 2025 watching debt funds extend, modify, and quietly recap the deals that should have been hitting the market. I told investors the wave was coming. I told myself the wave was coming. I built underwriting assumptions around a buying window that kept getting pushed to next quarter, then the quarter after, then the quarter after that.
By the end of 2025 I had mostly stopped saying it.
The operators I respect had mostly stopped saying it too.
The phrase "extend and pretend" became the default explanation. Debt funds were not going to crystallize losses on their books if they could avoid it. Sponsors who should have been forced sellers were being given workout terms instead of foreclosure notices. The wave, the one operators had been promised since 2023, was not arriving on the timeline anyone had built into a model.
And then in Q1 and Q2 of this year, it did.
TL;DR
The distressed apartment wave that operators waited on through 2023, 2024, and most of 2025 actually started transacting in Q1 and Q2 2026. The lag was real, the wait broke a lot of underwriting assumptions, and the operators who are buying now are looking at a window that is materially different than the one anyone modeled two years ago. This is the operator confession, the diagnostic on what changed, and the read on where the wave is actually concentrating.
I. The Confession
I want to start with the part most operator-facing content skips.
I was wrong about the timing.
Not wrong about the mechanic. The 2021 and 2022 vintage had structural problems. The floating-rate paper was always going to hit a wall. The rent growth assumptions in those underwriting models were never going to hold up. All of that was readable in 2023.
What I missed was the patience of the debt side.
The debt funds, the bridge lenders, the senior lenders sitting on the floating-rate paper had every incentive to extend rather than foreclose. Foreclosure crystallizes a loss. Extension keeps the loan on the books at par. For a debt fund that doesn't want to mark down its book in front of its own investors, extension is the rational move every quarter until it isn't.
For two years it kept being the rational move.
I built underwriting assumptions around a wave that the debt side had every reason to delay, and I underestimated how long they would delay it. That cost me deals I would have done if I had been more patient about the timing. It also cost me credibility with a couple of allocators who heard the "wave is coming" narrative from me in 2023 and watched the wave not arrive.
I am writing this piece partly because I think most operators owe the same confession and almost none of us have written it.
I was wrong about the timing, not the mechanic. The 2021–2022 vintage always had structural problems. What I missed was how long the debt side would choose extension over foreclosure.
— Andrew LeBaron
II. What Actually Changed In Q1 2026
The wave didn't arrive because operators got smarter. It arrived because the math on the debt side flipped.
Three things moved between late 2025 and Q1 2026.
The extension capacity ran out. Debt funds that had extended floating-rate deals once, twice, sometimes three times, hit the structural limit of how many times the same loan could be modified without triggering accounting or investor-disclosure consequences. The extension well dried up.
The replacement capital got more expensive. The bridge-to-bridge refinance market that had been the escape valve for sponsors with maturing paper in 2024 essentially closed. The new bridge debt available in early 2026 came with terms that made workouts look better than refinancings.
The dispersion inside the debt funds widened. The funds that had been "extending and pretending" started sorting their books. The deals with a credible path to recovery kept getting extended. The deals without one started moving toward sale. That sorting is what actually produced the Q1 transaction volume.
Trepp's overall CMBS special servicing rate climbed 27 basis points in March to 11.00% by the April report — the highest reading in more than a year — with multifamily special servicing pushing past 8% (it was 8.14% in January). That number is not just a stress indicator. It is the operational measure of how many loans moved out of "extend" into "work out." The mechanism that had been holding the wave back finally rolled over.
The Multi-Housing News piece from April 8 has the analyst version of this story — roughly $806 billion of multifamily debt maturing by 2028 and values down about 28% from their 2022 peak. The operators I have been talking to in the last 90 days have the on-the-ground version. They are the same story.
III. Where The Wave Is Actually Concentrating
The wave is not evenly distributed across the apartment market. It is concentrated in three places, and the operators buying right now are mostly buying inside those three pockets.
Floating-rate paper originated in 2021 and 2022. This is the largest concentration by a wide margin. Deals underwritten at near-zero rates, with rate caps that have expired or are about to, in markets where the rent growth assumptions never materialized. Most of the transactional distress in Q1 was here.
Supply-saturated Sun Belt submarkets. The metros that absorbed the most new construction during the 2021 and 2022 development boom are the same metros where operating performance underran the underwriting most badly. Phoenix, Austin, parts of Atlanta, parts of central Florida. The wave is concentrated inside specific submarkets within those metros, not evenly across them.
Class B value-add deals that didn't complete the value-add. A meaningful share of the distress is on deals where the sponsor raised capital to renovate units and reposition the property, then stopped the renovation when costs ran over and rents flattened. Those deals are sitting in a partial-execution state that makes them hard to refinance and harder to sell, which is why they are showing up in the workout pipeline now.
The institutional capital is reading this concentration correctly. Neighborhood Ventures launched a $25 million Opportunistic Fund II in January specifically targeting 30%+ discounts across 5–8 distressed assets. Heitman closed its $2 billion Value Partners Fund VI in the same window — the firm's largest closed-end fundraise ever. Multiple debt funds have launched dedicated workout vehicles. The product is being built for the wave that is now actually transacting.
The wave isn't evenly distributed. It's concentrated in floating-rate 2021–2022 paper, a handful of oversupplied Sun Belt submarkets, and half-finished Class B value-add deals. Underwrite the pocket, not the headline.
— Andrew LeBaron
IV. The Mistake I See Most Operators Making Now
Here is the part where the underwriting most needs to change.
The operators I see making the most expensive mistake in 2026 are the ones underwriting the wave the same way they would have in 2023.
In 2023 the assumption was that distressed deals would clear at deep discounts because supply of distressed paper would overwhelm demand. The actual 2026 wave is clearing at meaningful discounts, but not panic discounts, because the buying side is more disciplined and better-capitalized than the 2023 model anticipated.
The operators showing up at the table now are not the same operators who were promising investors distressed-deal fund returns in 2023. The ones who survived the wait are more conservative. The ones who joined the conversation in late 2025 came in with institutional capital and institutional underwriting. The bidding is competitive on the deals that are actually clean, and the deals that are not clean are not clearing at any price because the underwriting risk is too concentrated.
The implication for an operator looking at this market today:
The 30% discount that Neighborhood Ventures is targeting is a real number, and it is also the floor for the cleanest deals. The deals with capital stack issues, governance issues, or unfinished value-add are clearing further below that, but they come with execution risk that most operators are systematically underpricing.
The buying window is real. It is also more selective than the 2023 narrative predicted.
V. The Three Things I'm Doing Differently This Time
Since I owe the confession, I owe the recalibration too.
I'm underwriting the debt side first. Before I look at the asset, I am reading the loan documents, the rate cap status, the workout history, and the special servicer's posture. The asset is the second underwrite. The debt situation is the first.
I'm sizing for execution risk, not just basis. A deal at a 35% discount with a half-finished value-add and a fractured capital stack is not a cheaper version of the same deal at a 25% discount with cleaner documentation. The execution premium is the variable. I am pricing it in.
I'm being patient about the right type of deal, not the right type of market. Two years of waiting for the wave taught me that "the market" was the wrong unit of analysis. The right unit is the specific deal, the specific debt situation, the specific submarket. The patience I have left in me is going to the operators and deals that fit my actual underwriting, not to a market-level forecast that already cost me two years.
VI. The Read I Keep Coming Back To
The wave finally arrived. It arrived two years later than most of us said it would, in a different shape than most of us modeled, with a more disciplined buying side than most of us expected, and at discounts that are real but not panic.
The operators who are going to do well in this window are the ones who can hold two things in their head at once.
The window is real, and the wait broke a lot of underwriting assumptions.
Distressed paper is finally moving, and the buying side has more capital and more patience than the 2023 narrative predicted.
The 30% discount is the floor, and the execution risk inside the deals below that floor is the variable most operators are mispricing.
The wave isn't the trade. The selection inside the wave is the trade.
I waited two years to write that sentence. I want to be honest about the waiting because the waiting was the actual lesson. The deals are here now. The discipline the wait imposed is the only reason I trust my own underwriting on them today.
If you're looking at the distressed apartment market right now and trying to figure out which deals inside the wave are actually underwriteable, I keep 30 minutes a week open for conversations like that. No pitch. Just the read. Book a meeting with me here.
— Andrew
The 30% discount is the floor, and the execution risk inside the deals below that floor is the variable most operators are mispricing. The wave isn't the trade. The selection inside the wave is the trade.
— Andrew LeBaron

Andrew LeBaron