A Lesson from Playing Catch
Last month I was throwing a baseball with my son Asa at the park. He kept running farther and farther back. He wanted to prove he could launch it all the way to me from deep in the outfield. The problem was, his arm was not there yet. The ball kept dying short. He was getting frustrated, especially since his younger brother (two years younger) can already throw farther than he can.

So I did what any dad would do. I started walking toward him. I closed the gap, a few steps at a time, until the ball was actually landing in my glove. He did not need a stronger arm. He needed me to meet him where he was.
Right now, the commercial real estate market is throwing a ball that keeps dying short. Owners who paid top-of-market prices in 2018 and 2019 are watching their buildings trade at 15 to 50 cents on the dollar. They cannot refinance. They cannot inject more equity. They cannot close the gap. So someone else is stepping in, walking toward the ball, and catching what the last owner could not hold on to.
On April 9, David Werner closed on a 193,000-square-foot office building in Hell's Kitchen for just over $40 million. DivcoWest paid $131 million for it in 2018. That is not a discount. That is an equity gift.
And Werner is not alone. Three deals. Three cities. All within the last three weeks. All purchased at a fraction of what they last traded for. All bought by family offices or private operators while institutional capital sits frozen, waiting for a rate environment that may never arrive.
This is not a blip.
This is a pattern.
And if you understand the mechanics behind it, you will see why some of the sharpest capital allocators in the country are moving right now while everyone else waits for permission.
The Receipts
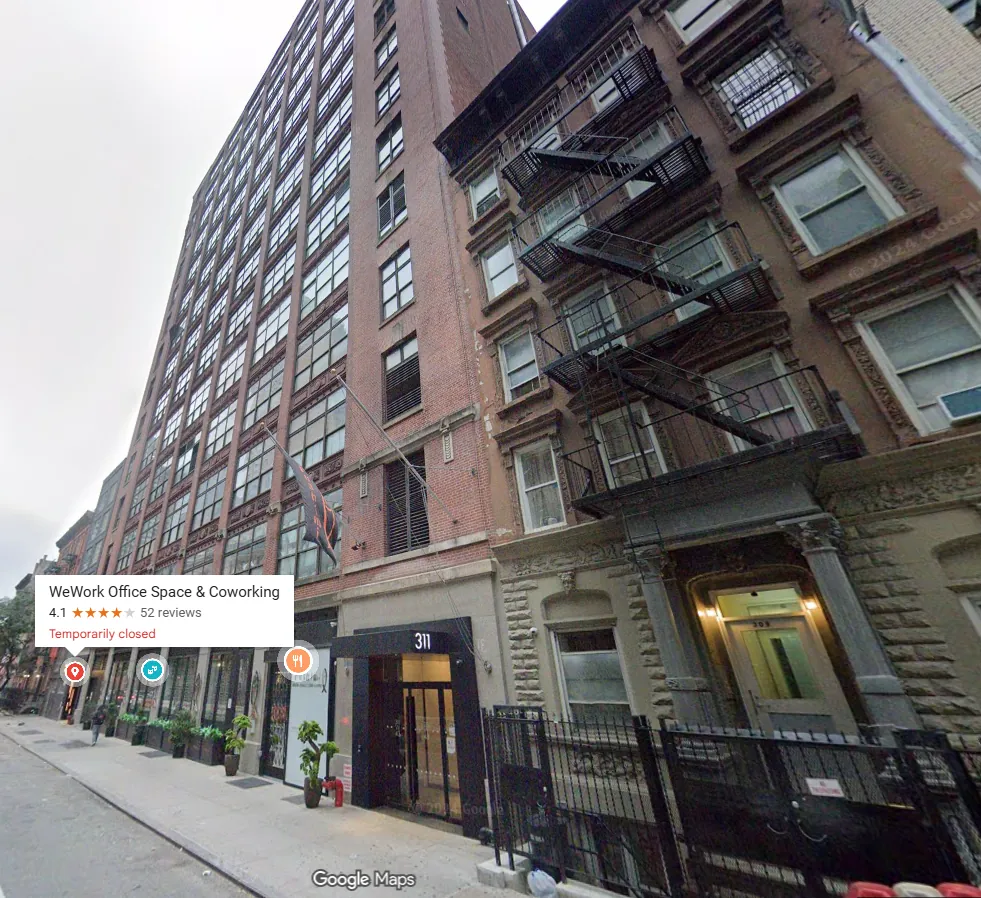
WeWork was the anchor tenant at 311 West 43rd. They abandoned the lease in their 2023 bankruptcy. DivcoWest sued them for $30 million in unpaid rent. Werner's plan? Convert to residential. He paid less than a third of what DivcoWest did seven years ago.
He is not the only one moving.
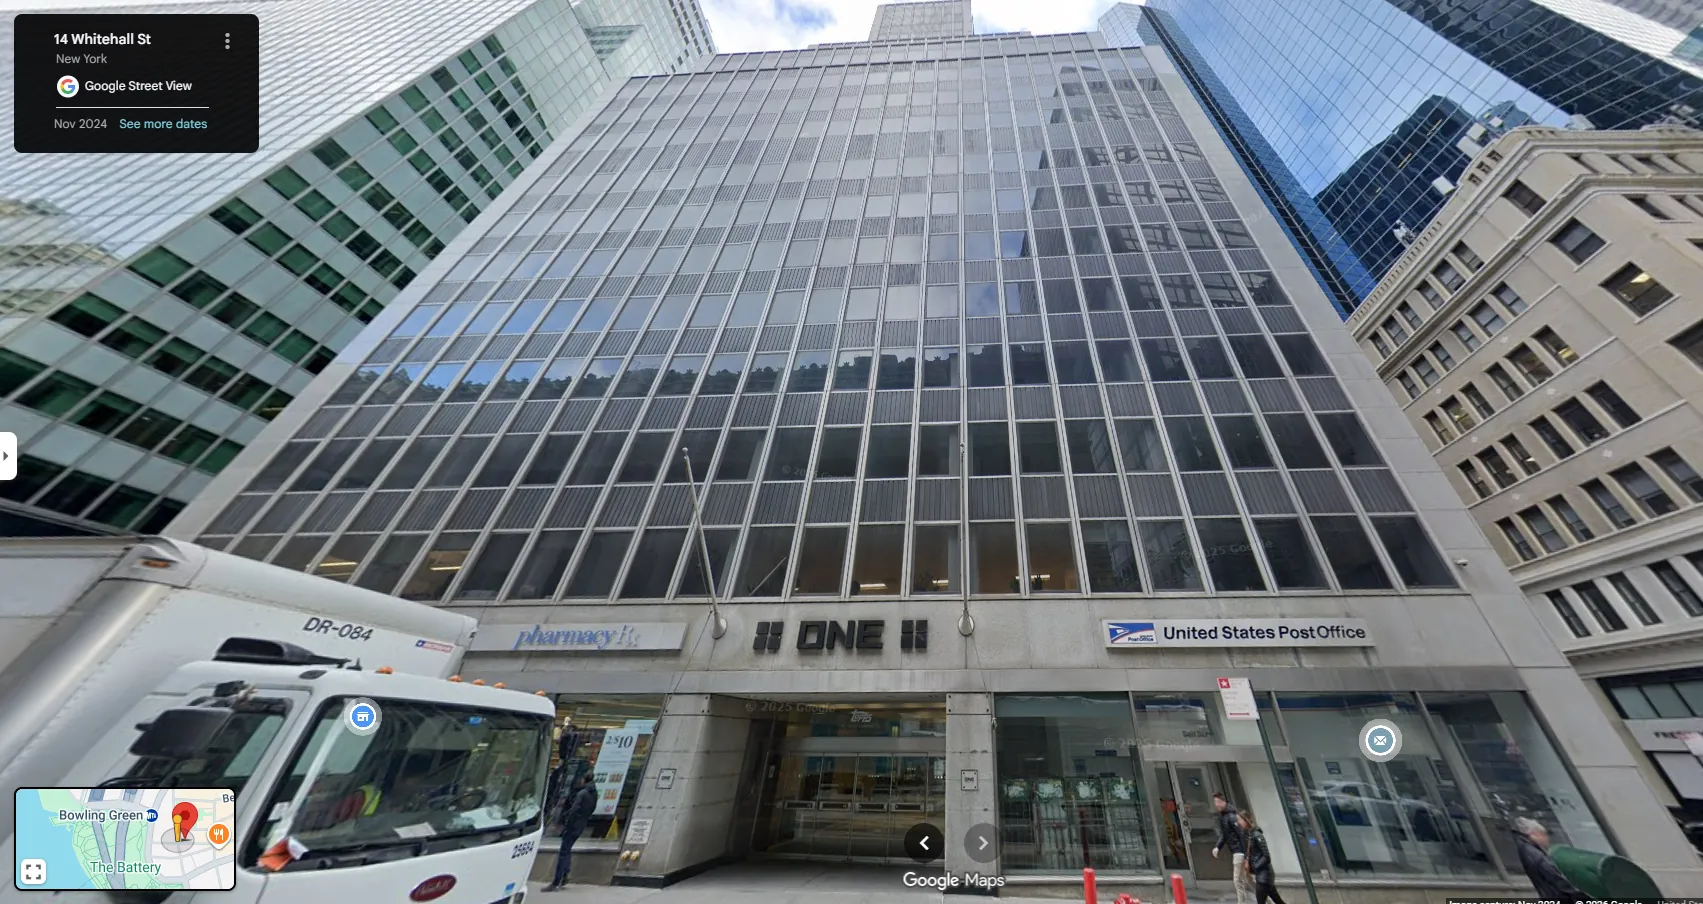
Nathan Berman and Idan Ofer, 1 Whitehall Street, Manhattan. On April 7, Metro Loft Management and Quantum Pacific Group went into contract on this 380,000-square-foot Financial District tower for approximately $100 million. The Chetrit Group bought it for $181.5 million in 2019, then stopped making mortgage payments in July 2023. LoanCore Capital foreclosed in December 2024. Berman and Ofer plan to convert it into rental apartments. That is barely half of what Chetrit paid.
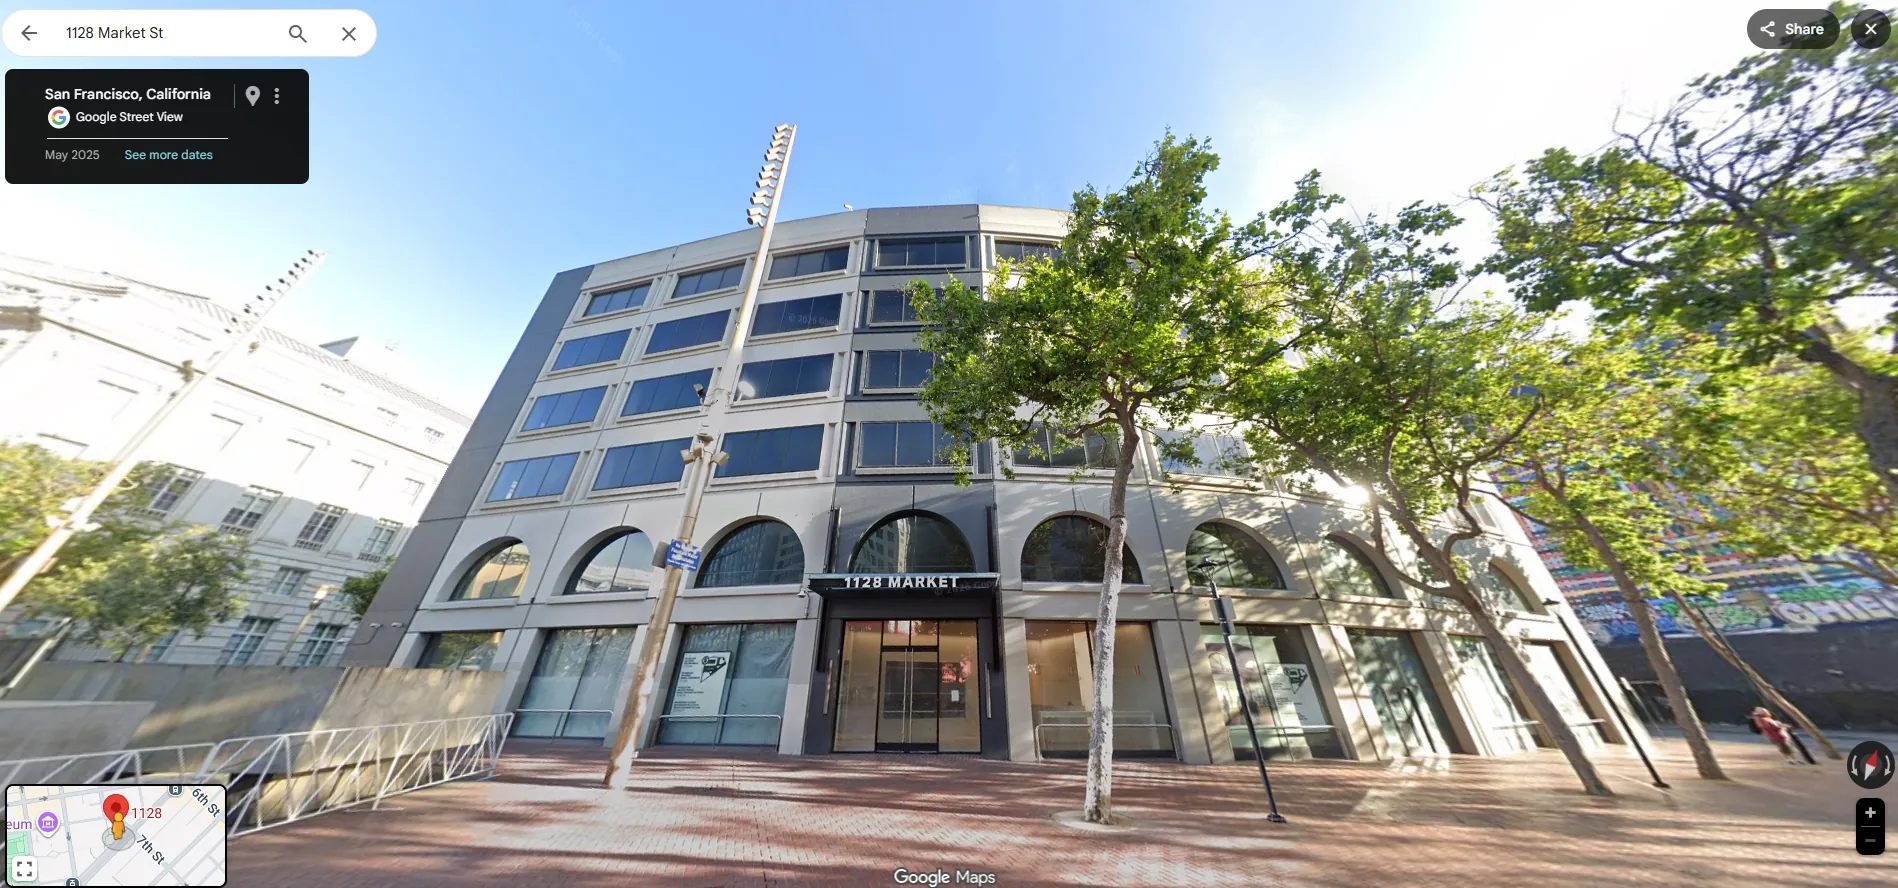
Bayhill Ventures, 1128 Market Street, San Francisco. On March 27, Bayhill picked up this 76,500-square-foot Mid-Market office building for $7.6 million. Canyon Catalyst Fund and Rubicon Point Partners paid roughly $50 million for it in 2018. They surrendered it to East West Bank via deed in lieu of foreclosure in late 2023. Bayhill's price? About 15 cents on the dollar. And unlike Werner and Berman, Bayhill is not converting to residential. They are reopening it as office, betting that a quality building near transit will lease in any market.
Three deals.
Three different buyers.
Two conversion plays.
One office repositioning.
Same thesis: buy the distress, reposition the asset, ride the next cycle.
Think you know the real numbers behind these deals?
6 questions · ~3 min
Why These Deals Exist Right Now
The real story is structural, not situational. People look at these numbers and think the sellers just made bad bets. Some of them did. But the mechanics are bigger than any single deal.
CRE Debt Maturity Wall ($B, 2025–2027)
Nearly $3.1 trillion in commercial mortgages mature between 2025 and 2027, with the wall peaking at $1.26 trillion in 2027. Office debt alone accounts for $187 billion of the 2025 wave. When a loan matures and the building is worth less than the debt, owners must inject equity, negotiate an extension, or hand back the keys. DivcoWest, Chetrit, and Canyon Catalyst all chose some version of option three.
In 2025, $957 billion in commercial mortgages matured. In 2026, another $875 billion to $936 billion is set to mature. And in 2027, the wall peaks at $1.26 trillion. Office debt alone accounts for $187 billion of the 2025 wave. That is 19.5% of the total.
When a loan matures and the building is worth less than the debt on it, the owner has three options:
- Inject more equity
- Negotiate an extension with the lender
- Hand back the keys
DivcoWest, Chetrit, and Canyon Catalyst all chose some version of option three. And when lenders take back assets they do not want to own, they sell at whatever price clears the books.
That is how a $131 million building trades for $40 million. Not because the real estate is worthless. Because the capital structure above it collapsed.
The wall of CRE debt coming due that most people are not fully grasping is like a sneaky assassin putting knives in owners' backs.
— Andrew LeBaron
The Conversion Play
What makes these deals work is not just the acquisition price. It is what happens after.
Two of the three buyers are planning office-to-residential conversions. And the economics of that strategy have shifted dramatically in the last two years.
NYC Office-to-Residential Conversion Volume (Million SF)
Office-to-residential conversion volume in New York City has accelerated sharply, from 1.6 million SF in 2023 to 4.1 million SF by August 2025. Another 8.8 million SF is in the pipeline. New York's 467-m tax incentive program and a 500,000-unit housing shortage are aligning policy tailwinds with market incentives.
In New York, office-to-residential conversion volume hit 1.6 million square feet in 2023, then doubled to 3.3 million in 2024, then jumped again to 4.1 million by August 2025. Another 8.8 million square feet of conversions are in the pipeline.
The cost is significant. Developers should plan on $500 to $600 per square foot for a conversion in New York. That can exceed new construction in some cases. But here is where the math gets interesting:
If you are buying the building at 15 to 30 cents on the dollar, your all-in basis is still well below replacement cost. Werner paid roughly $207 per square foot for 311 West 43rd. Even at $500 per square foot in conversion costs, his total basis is around $707 per square foot for a residential asset in Hell's Kitchen. New residential construction in Manhattan runs $800 to $1,200 per square foot. He is already ahead before the first tenant moves in.
When 20% of an office market sits empty and the city is short 500,000 housing units, the policy tailwinds and the market incentives align. New York's 467-m tax incentive program is adding fuel. That does not happen often.
We Have Seen This Before
This is not the first time sharp buyers have loaded up on distressed office assets during a cycle reset. It happened after the savings and loan crisis. It happened after the 2008 financial crisis. And the results were not subtle.
Average 5-Year Total Returns by Distressed Office Vintage (%)
Office acquisitions made during the 1991–1993 downturn delivered average five-year returns of 82%. The 2009–2011 vintage averaged 67%. Not annualized, but total return over five years. The playbook is the same every cycle: distress creates mispriced assets, patient capital acquires below replacement cost, the market normalizes, and returns compress back to mean.
Office acquisitions made during the 1991 to 1993 downturn delivered average five-year returns of 82%. The 2009 to 2011 vintage? Average five-year returns of 67%. Not annualized. Total return over five years. That is the kind of performance that builds generational wealth for the families and operators willing to move while everyone else is paralyzed by headlines.
The playbook is the same every cycle. Distress creates mispriced assets. Patient capital acquires them below replacement cost. The market normalizes. Returns compress back to mean. The window is finite. And the buyers who win are the ones who had a thesis, a team, and dry powder before the deals showed up.
How Family Offices Are Actually Moving
Sometimes the move is not to throw harder. It is to close the gap. I think about that when I talk to sponsors who are frustrated that family office capital is not "landing" for them. The capital is out there. The intent is real. But if your pitch, your transparency, and your GP alignment are not meeting family offices where they are right now, the ball dies short every time.
Let me be specific about what "family offices are buying" actually looks like in practice, because the structure matters as much as the strategy.
Real estate is now the top asset class for family offices, accounting for 39% of allocations in the first half of 2025. Up from 26% two years earlier. Aggregate deal value jumped from $2.1 billion to $7.5 billion over the same period. That is not a rounding error. That is a fundamental reallocation.
44% of family offices now prefer direct investment in private real estate over fund commitments. They are not writing blind checks to mega-funds. They want to pick the asset, know the operator, and see every line of the cap stack. Club deals, where multiple family offices co-invest alongside an operator, account for 69% of family office deal flow. The days of a single LP writing a $50 million check into a blind pool are fading. What is replacing it is more collaborative, more transparent, and more hands-on.
The minimum investment thresholds are dropping. Historically, direct deals required $5 million to $10 million minimums. Operators are now structuring co-investments at $250,000 to $500,000 without diluting the strategy. That is opening family office capital to a much wider pool of sponsors and deals. If you are raising for a value-add or opportunistic strategy and you are not structuring for family office co-investment, you are ignoring the fastest-growing capital source in private real estate.
The One Big Beautiful Bill Act's restoration of 100% bonus depreciation is adding tailwinds in 2026, making capital-intensive projects like conversions even more tax-efficient for direct investors. Cash flow, depreciation deductions, and 1031 exchanges. Real estate remains the most tax-advantaged asset class for high-net-worth families. And they know it.
The sponsors winning family office capital right now share three things: a clear thesis on distress, GP alignment through meaningful co-investment, and property-level transparency that institutional LPs expect but many mid-market operators still don't provide.
— Andrew LeBaron
Why This Matters for Capital Raisers
If you are raising private capital for real estate right now, there is a window opening that will not stay open indefinitely.
The pricing window is closing. With nearly $2.8 trillion in CRE loans maturing between 2025 and 2027, distressed inventory is peaking right now. The deals trading at 15 to 50 cents on the dollar exist because of a convergence: loan maturities, elevated rates, and institutional paralysis. Once rates normalize or institutional capital rotates back in (and the Ares $5.4 billion close suggests it is already starting), these prices disappear.
Family offices are actively seeking deal flow. But not the way they did in 2021. They want GP co-investment. Skin in the game, not just sweat equity. They want property-level reporting and realistic downside scenarios. They want to see your specific thesis on distress, not a generic "value-add" pitch deck. Quality over quantity. Fewer, larger, more strategic deals.
Werner. Berman. Ofer. Bayhill. They all share three things: a clear thesis on distress, the ability to move fast when a lender needs to offload, and a repositioning strategy (whether conversion or re-tenanting) that creates value in the next cycle. That is not speculation. That is pattern recognition.
Here Is the Move
Audit your investor communications for three things before your next LP meeting: a specific distress thesis (not just "value-add"), documented GP co-investment, and property-level reporting. If any of those three are missing from your pitch materials, you are leaving family office capital on the table at the exact moment they are writing checks.
The window between distress and recovery is measured in quarters, not years. Office acquisitions from the last two major downturns returned 67% to 82% over five years. The family offices already know that. The question is whether you are positioned to capture their capital before the window closes.
A Lesson from Playing Catch
Last month I was throwing a baseball with my son Asa at the park. He kept running farther and farther back. He wanted to prove he could launch it all the way to me from deep in the outfield. The problem was, his arm was not there yet. The ball kept dying short. He was getting frustrated, especially since his younger brother (two years younger) can already throw farther than he can.
So I did what any dad would do. I started walking toward him. I closed the gap, a few steps at a time, until the ball was actually landing in my glove. He did not need a stronger arm. He needed me to meet him where he was.
Right now, the commercial real estate market is throwing a ball that keeps dying short. Owners who paid top-of-market prices in 2018 and 2019 are watching their buildings trade at 15 to 50 cents on the dollar. They cannot refinance. They cannot inject more equity. They cannot close the gap. So someone else is stepping in, walking toward the ball, and catching what the last owner could not hold on to.
On April 9, David Werner closed on a 193,000-square-foot office building in Hell's Kitchen for just over $40 million. DivcoWest paid $131 million for it in 2018. That is not a discount. That is an equity gift.
And Werner is not alone. Three deals. Three cities. All within the last three weeks. All purchased at a fraction of what they last traded for. All bought by family offices or private operators while institutional capital sits frozen, waiting for a rate environment that may never arrive.
This is not a blip.
This is a pattern.
And if you understand the mechanics behind it, you will see why some of the sharpest capital allocators in the country are moving right now while everyone else waits for permission.
The Receipts
WeWork was the anchor tenant at 311 West 43rd. They abandoned the lease in their 2023 bankruptcy. DivcoWest sued them for $30 million in unpaid rent. Werner's plan? Convert to residential. He paid less than a third of what DivcoWest did seven years ago.
He is not the only one moving.
Nathan Berman and Idan Ofer, 1 Whitehall Street, Manhattan. On April 7, Metro Loft Management and Quantum Pacific Group went into contract on this 380,000-square-foot Financial District tower for approximately $100 million. The Chetrit Group bought it for $181.5 million in 2019, then stopped making mortgage payments in July 2023. LoanCore Capital foreclosed in December 2024. Berman and Ofer plan to convert it into rental apartments. That is barely half of what Chetrit paid.
Bayhill Ventures, 1128 Market Street, San Francisco. On March 27, Bayhill picked up this 76,500-square-foot Mid-Market office building for $7.6 million. Canyon Catalyst Fund and Rubicon Point Partners paid roughly $50 million for it in 2018. They surrendered it to East West Bank via deed in lieu of foreclosure in late 2023. Bayhill's price? About 15 cents on the dollar. And unlike Werner and Berman, Bayhill is not converting to residential. They are reopening it as office, betting that a quality building near transit will lease in any market.
Three deals.
Three different buyers.
Two conversion plays.
One office repositioning.
Same thesis: buy the distress, reposition the asset, ride the next cycle.
Think you know the real numbers behind these deals?
6 questions · ~3 min
Why These Deals Exist Right Now
The real story is structural, not situational. People look at these numbers and think the sellers just made bad bets. Some of them did. But the mechanics are bigger than any single deal.
CRE Debt Maturity Wall ($B, 2025–2027)
Nearly $3.1 trillion in commercial mortgages mature between 2025 and 2027, with the wall peaking at $1.26 trillion in 2027. Office debt alone accounts for $187 billion of the 2025 wave. When a loan matures and the building is worth less than the debt, owners must inject equity, negotiate an extension, or hand back the keys. DivcoWest, Chetrit, and Canyon Catalyst all chose some version of option three.
In 2025, $957 billion in commercial mortgages matured. In 2026, another $875 billion to $936 billion is set to mature. And in 2027, the wall peaks at $1.26 trillion. Office debt alone accounts for $187 billion of the 2025 wave. That is 19.5% of the total.
When a loan matures and the building is worth less than the debt on it, the owner has three options:
- Inject more equity
- Negotiate an extension with the lender
- Hand back the keys
DivcoWest, Chetrit, and Canyon Catalyst all chose some version of option three. And when lenders take back assets they do not want to own, they sell at whatever price clears the books.
That is how a $131 million building trades for $40 million. Not because the real estate is worthless. Because the capital structure above it collapsed.
The wall of CRE debt coming due that most people are not fully grasping is like a sneaky assassin putting knives in owners' backs.
— Andrew LeBaron
The Conversion Play
What makes these deals work is not just the acquisition price. It is what happens after.
Two of the three buyers are planning office-to-residential conversions. And the economics of that strategy have shifted dramatically in the last two years.
NYC Office-to-Residential Conversion Volume (Million SF)
Office-to-residential conversion volume in New York City has accelerated sharply, from 1.6 million SF in 2023 to 4.1 million SF by August 2025. Another 8.8 million SF is in the pipeline. New York's 467-m tax incentive program and a 500,000-unit housing shortage are aligning policy tailwinds with market incentives.
In New York, office-to-residential conversion volume hit 1.6 million square feet in 2023, then doubled to 3.3 million in 2024, then jumped again to 4.1 million by August 2025. Another 8.8 million square feet of conversions are in the pipeline.
The cost is significant. Developers should plan on $500 to $600 per square foot for a conversion in New York. That can exceed new construction in some cases. But here is where the math gets interesting:
If you are buying the building at 15 to 30 cents on the dollar, your all-in basis is still well below replacement cost. Werner paid roughly $207 per square foot for 311 West 43rd. Even at $500 per square foot in conversion costs, his total basis is around $707 per square foot for a residential asset in Hell's Kitchen. New residential construction in Manhattan runs $800 to $1,200 per square foot. He is already ahead before the first tenant moves in.
When 20% of an office market sits empty and the city is short 500,000 housing units, the policy tailwinds and the market incentives align. New York's 467-m tax incentive program is adding fuel. That does not happen often.
We Have Seen This Before
This is not the first time sharp buyers have loaded up on distressed office assets during a cycle reset. It happened after the savings and loan crisis. It happened after the 2008 financial crisis. And the results were not subtle.
Average 5-Year Total Returns by Distressed Office Vintage (%)
Office acquisitions made during the 1991–1993 downturn delivered average five-year returns of 82%. The 2009–2011 vintage averaged 67%. Not annualized, but total return over five years. The playbook is the same every cycle: distress creates mispriced assets, patient capital acquires below replacement cost, the market normalizes, and returns compress back to mean.
Office acquisitions made during the 1991 to 1993 downturn delivered average five-year returns of 82%. The 2009 to 2011 vintage? Average five-year returns of 67%. Not annualized. Total return over five years. That is the kind of performance that builds generational wealth for the families and operators willing to move while everyone else is paralyzed by headlines.
The playbook is the same every cycle. Distress creates mispriced assets. Patient capital acquires them below replacement cost. The market normalizes. Returns compress back to mean. The window is finite. And the buyers who win are the ones who had a thesis, a team, and dry powder before the deals showed up.
How Family Offices Are Actually Moving
Sometimes the move is not to throw harder. It is to close the gap. I think about that when I talk to sponsors who are frustrated that family office capital is not "landing" for them. The capital is out there. The intent is real. But if your pitch, your transparency, and your GP alignment are not meeting family offices where they are right now, the ball dies short every time.
Let me be specific about what "family offices are buying" actually looks like in practice, because the structure matters as much as the strategy.
Real estate is now the top asset class for family offices, accounting for 39% of allocations in the first half of 2025. Up from 26% two years earlier. Aggregate deal value jumped from $2.1 billion to $7.5 billion over the same period. That is not a rounding error. That is a fundamental reallocation.
44% of family offices now prefer direct investment in private real estate over fund commitments. They are not writing blind checks to mega-funds. They want to pick the asset, know the operator, and see every line of the cap stack. Club deals, where multiple family offices co-invest alongside an operator, account for 69% of family office deal flow. The days of a single LP writing a $50 million check into a blind pool are fading. What is replacing it is more collaborative, more transparent, and more hands-on.
The minimum investment thresholds are dropping. Historically, direct deals required $5 million to $10 million minimums. Operators are now structuring co-investments at $250,000 to $500,000 without diluting the strategy. That is opening family office capital to a much wider pool of sponsors and deals. If you are raising for a value-add or opportunistic strategy and you are not structuring for family office co-investment, you are ignoring the fastest-growing capital source in private real estate.
The One Big Beautiful Bill Act's restoration of 100% bonus depreciation is adding tailwinds in 2026, making capital-intensive projects like conversions even more tax-efficient for direct investors. Cash flow, depreciation deductions, and 1031 exchanges. Real estate remains the most tax-advantaged asset class for high-net-worth families. And they know it.
The sponsors winning family office capital right now share three things: a clear thesis on distress, GP alignment through meaningful co-investment, and property-level transparency that institutional LPs expect but many mid-market operators still don't provide.
— Andrew LeBaron
Why This Matters for Capital Raisers
If you are raising private capital for real estate right now, there is a window opening that will not stay open indefinitely.
The pricing window is closing. With nearly $2.8 trillion in CRE loans maturing between 2025 and 2027, distressed inventory is peaking right now. The deals trading at 15 to 50 cents on the dollar exist because of a convergence: loan maturities, elevated rates, and institutional paralysis. Once rates normalize or institutional capital rotates back in (and the Ares $5.4 billion close suggests it is already starting), these prices disappear.
Family offices are actively seeking deal flow. But not the way they did in 2021. They want GP co-investment. Skin in the game, not just sweat equity. They want property-level reporting and realistic downside scenarios. They want to see your specific thesis on distress, not a generic "value-add" pitch deck. Quality over quantity. Fewer, larger, more strategic deals.
Werner. Berman. Ofer. Bayhill. They all share three things: a clear thesis on distress, the ability to move fast when a lender needs to offload, and a repositioning strategy (whether conversion or re-tenanting) that creates value in the next cycle. That is not speculation. That is pattern recognition.
Here Is the Move
Audit your investor communications for three things before your next LP meeting: a specific distress thesis (not just "value-add"), documented GP co-investment, and property-level reporting. If any of those three are missing from your pitch materials, you are leaving family office capital on the table at the exact moment they are writing checks.
The window between distress and recovery is measured in quarters, not years. Office acquisitions from the last two major downturns returned 67% to 82% over five years. The family offices already know that. The question is whether you are positioned to capture their capital before the window closes.
Test Your Knowledge
How well do you know commercial real estate?

Andrew LeBaron