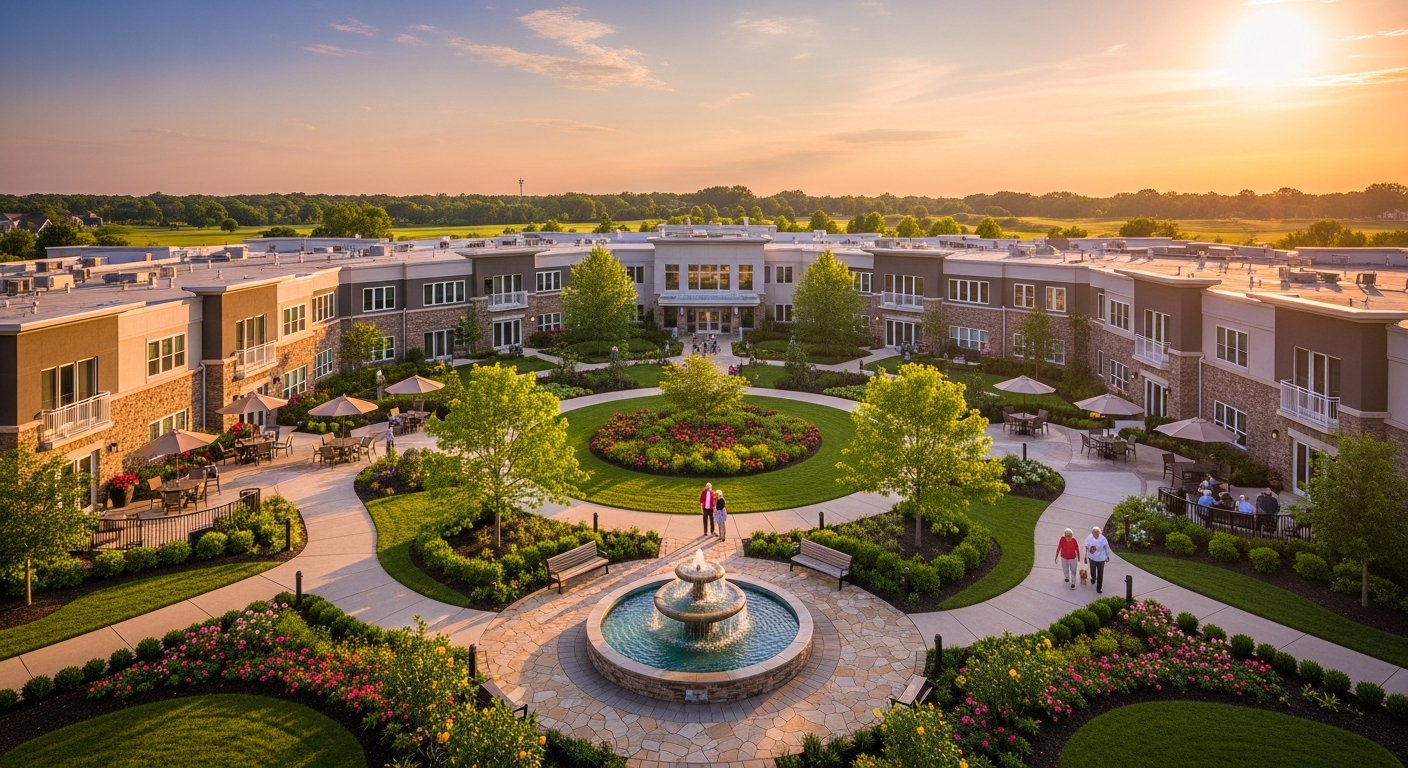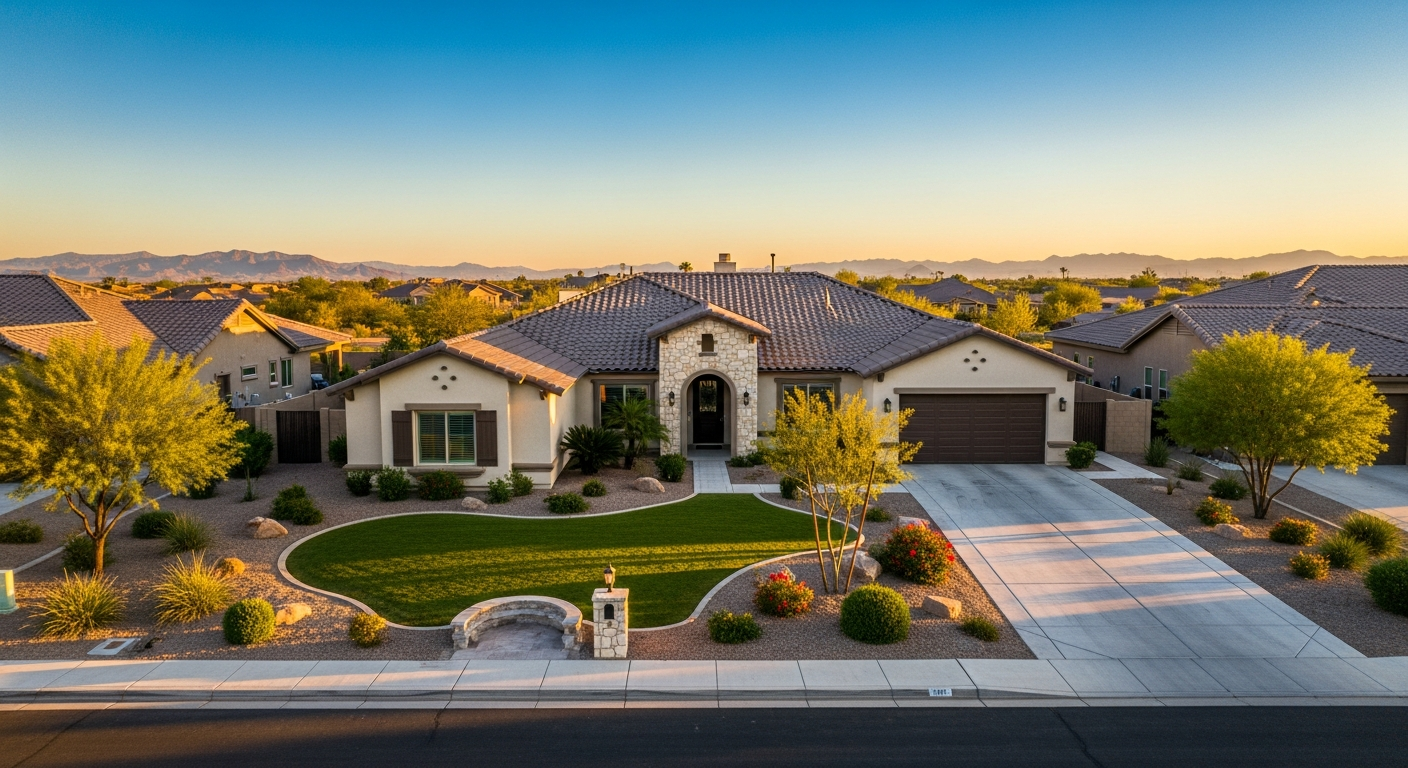
The next great real estate opportunity is not in another country. It is not in a new asset class no one has heard of. It is happening right now, in residential neighborhoods across America, one aging household at a time.
Seventy-three million baby boomers are moving through their sixties and seventies. They built the most prosperous generation in American history. The Federal Reserve's Distributional Financial Accounts shows they currently hold $88.5 trillion in total wealth — 51.4% of all U.S. household wealth as of Q1 2025. And now, they are deciding where they want to spend the final chapter of their lives.
The answer, overwhelmingly, is: home.
The Preference Is Clear: Seniors Want to Stay Home
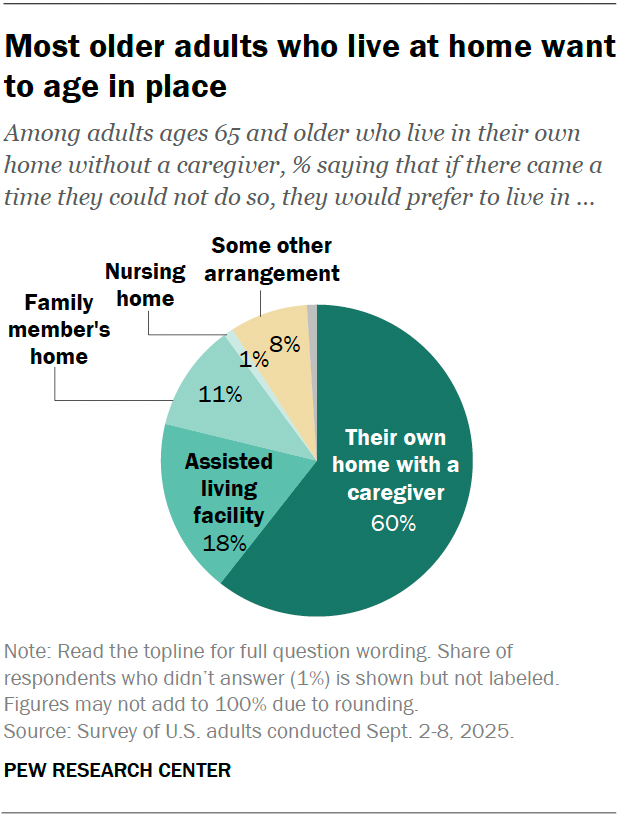
On February 26, 2026, the Pew Research Center published findings from a survey of 8,750 U.S. adults ages 65 and older who currently live at home without a caregiver. The survey was conducted September 2–8, 2025. The question was direct: if there came a time when you could no longer live independently, where would you prefer to live?
60% said their own home — with a caregiver. Only 18% said an assisted living facility. Only 1% said a nursing home.
This is not a niche preference. This is the dominant sentiment of an entire generation, confirmed by the most recent available data. And it is a sentiment the real estate industry is wildly underprepared to serve.
Think about what that means in structural terms. The senior housing industry has spent the last three decades building almost exclusively for the 18% who prefer assisted living and the 1% who prefer nursing homes. The 60% — the largest segment by a factor of more than three — have had almost nothing built to specifically serve their stated preference.
That is a market failure on a generational scale. And market failures of this magnitude tend to produce investment opportunities of corresponding size.
Where Seniors Would Prefer to Live If They Could No Longer Live Independently (%)
Pew Research Center published February 26, 2026. Survey of 8,750 U.S. adults ages 65+ conducted September 2–8, 2025. The data confirms the industry's fundamental misallocation: it has built aggressively for the 18% who prefer assisted living while the 60% who prefer to stay home have had almost nothing built specifically for them.
The industry has spent three decades building for the 18% who want assisted living. The 60% who want to stay home have had almost nothing built specifically for them. That is a market failure on a generational scale.
— Andrew LeBaron
The Wealth Transfer That Changes Everything
The numbers behind this demographic story are staggering.
Baby boomers — born between 1946 and 1964 — currently control $88.5 trillion in household wealth, per the Federal Reserve's Q1 2025 Distributional Financial Accounts release. That figure encompasses real estate equity, retirement accounts, investment portfolios, business interests, and personal savings accumulated across five decades of earning. It is the largest private wealth concentration by a single generation in American history — equivalent to 51.4% of every dollar of wealth owned by every household in the United States.
That wealth is now in motion.
As boomers age, their assets pass to Gen X and millennials through inheritance, inter-vivos gifting, trust distributions, and estate settlement. The children of the boomers are inheriting homes, portfolios, and in many cases, direct financial responsibility for their parents' care and housing decisions.
There are approximately 65 million Gen X adults and 72 million millennials in the United States. They are the primary recipients of this transfer, and they are making two categories of housing decisions with it: decisions about their own futures and decisions about where their parents will live. Both flow toward the same conclusion — home-based senior housing.
The implications for real estate are significant. Adult children who inherit assets or receive gifts are increasingly making care decisions for aging parents with meaningful capital behind them. They are willing to pay a premium for safety, dignity, and quality. The demand is not just demographic — it is financially backed by one of the largest wealth transfers in economic history.
$88.5 trillion. That is the current wealth held by baby boomers, per the Federal Reserve's Q1 2025 data. Wherever that capital lands, the housing decisions follow.
— Federal Reserve Distributional Financial Accounts, Q1 2025
Peak 65: The Most Important Demographic Year in U.S. History
The demographic arithmetic of 2025 is unlike anything the country has seen before.
2025 is the "Peak 65" year — the year with the highest number of Americans turning 65 in U.S. history. Approximately 11,400 Americans cross the age-65 threshold every single day, according to Alliance for Lifetime Income research. This surpasses the widely-cited but outdated "10,000 per day" figure; the actual 2025 pace is materially higher, and 2025 represents the absolute all-time peak.
This is not coincidental. The bulk of the baby boom occurred in the mid-to-late 1950s and early 1960s, meaning the largest single cohorts of boomers — the ones born in 1957, 1958, and 1959 — are crossing 65 in 2022–2024, and the peak concentrations follow. 2025 is the apex. The daily rate remains near-record through 2026 and 2027 before gradually easing.
Every person who will turn 65 through 2040 is already alive today. There is no uncertainty in this pipeline. It is a mathematical certainty written in census records.
What makes this moment even more compelling is what we know about longevity. According to the Social Security Administration's 2025 Trustees Report period life table, a 65-year-old woman has approximately 21 additional years of expected life; a man has approximately 18.5 years. A senior entering the market today at 65 is looking at a housing runway of nearly two decades. These are not transitional accommodations — they are long-duration residential commitments where quality, safety, and appropriateness of housing matters enormously over time.
The fastest-growing segment of the senior population is not the newly-minted 65-year-olds. It is the 85-and-older cohort, projected by the Census Bureau to more than double from approximately 7 million today to over 14 million by 2040. This oldest-old population has the most acute need for modified, care-enabled housing — and the least supply designed to serve it.
Think you know the facts behind the headlines?
6 questions · ~3 min
The Supply Crisis Is Not a Rumor: It Is a Number
The National Investment Center for Seniors Housing & Care tracks construction and delivery data across the senior housing sector with quarterly precision. The Q2 2025 numbers are stark.
The sector needs to deliver 90,000+ new senior housing units annually to keep pace with demographic demand. As of Q2 2025, fewer than 18,000 units were under construction nationally — the lowest level since Q1 2013, down 23% year-over-year, representing roughly 20% of the required pace.
The delivery numbers are even more alarming. In Q2 2025, the industry delivered approximately 800–809 new senior housing units — a figure that had never previously fallen below 1,000 in NIC's recorded history, and the lowest quarterly delivery since 2005.
The NIC MAP Vision Senior Housing Market Outlook Report projects the cumulative supply gap will reach $275 billion by 2030, representing a 550,000-unit shortfall at current development paces. The gap is not narrowing. It is widening.
On a positive note, NIC MAP Vision data shows senior housing occupancy has now hit 88.1% — the 16th consecutive quarter of improvement, a streak of sustained demand that has no modern precedent in the asset class. Rising occupancy with a collapsing supply pipeline is, for investors, a textbook setup.
For context: the math of demographics versus construction timelines means the supply deficit will compound for at least the next decade, regardless of what developers start building today. Ground-up senior housing construction takes 24–36 months from permit to certificate of occupancy. Scattered-site residential acquisition and modification takes 60–90 days. The speed advantage alone is a structural edge.
Senior Housing: Annual Units Needed vs. Current Pipeline (Q2 2025)
NIC MAP Vision Q2 2025 data: fewer than 18,000 units were under construction nationally — the lowest level since Q1 2013, down 23% year-over-year. Approximately 800–809 units were actually delivered in Q2 2025, a figure that had never previously fallen below 1,000 in NIC's recorded history. Against an annual need of 90,000+ units, the gap is not narrowing. It is widening.
809 new senior housing units were delivered in Q2 2025 — a figure that had never previously fallen below 1,000 in NIC's recorded history. The industry needs 90,000 units per year. That is not a gap. That is a canyon.
— NIC MAP Vision Q2 2025 Data
The Opportunity: Scattered-Site Residential Senior Housing
The traditional response to senior housing demand has been the Big Box model — large assisted living campuses and memory care facilities that house 150 to 400 residents under one roof. These are capital-intensive to develop ($200,000–$400,000+ per unit all-in), operationally complex, and increasingly misaligned with what seniors actually want.
The model gaining traction among a growing cohort of operators — and what I believe represents the biggest residential real estate opportunity since 2008 — is scattered-site senior housing.
The concept is operationally elegant: acquire standard single-family homes and small residential properties in desirable neighborhoods, make targeted ADA-compliant modifications, and operate them as premium aging-in-place residences with coordinated care services delivered by a central team.
Instead of one large facility with 200 beds, you operate 20 to 30 homes across a neighborhood, each housing two to four seniors, each maintaining its own character and community feel. The residents remain in a home environment. The operator delivers the services with an efficiency model made possible by AI monitoring technology.
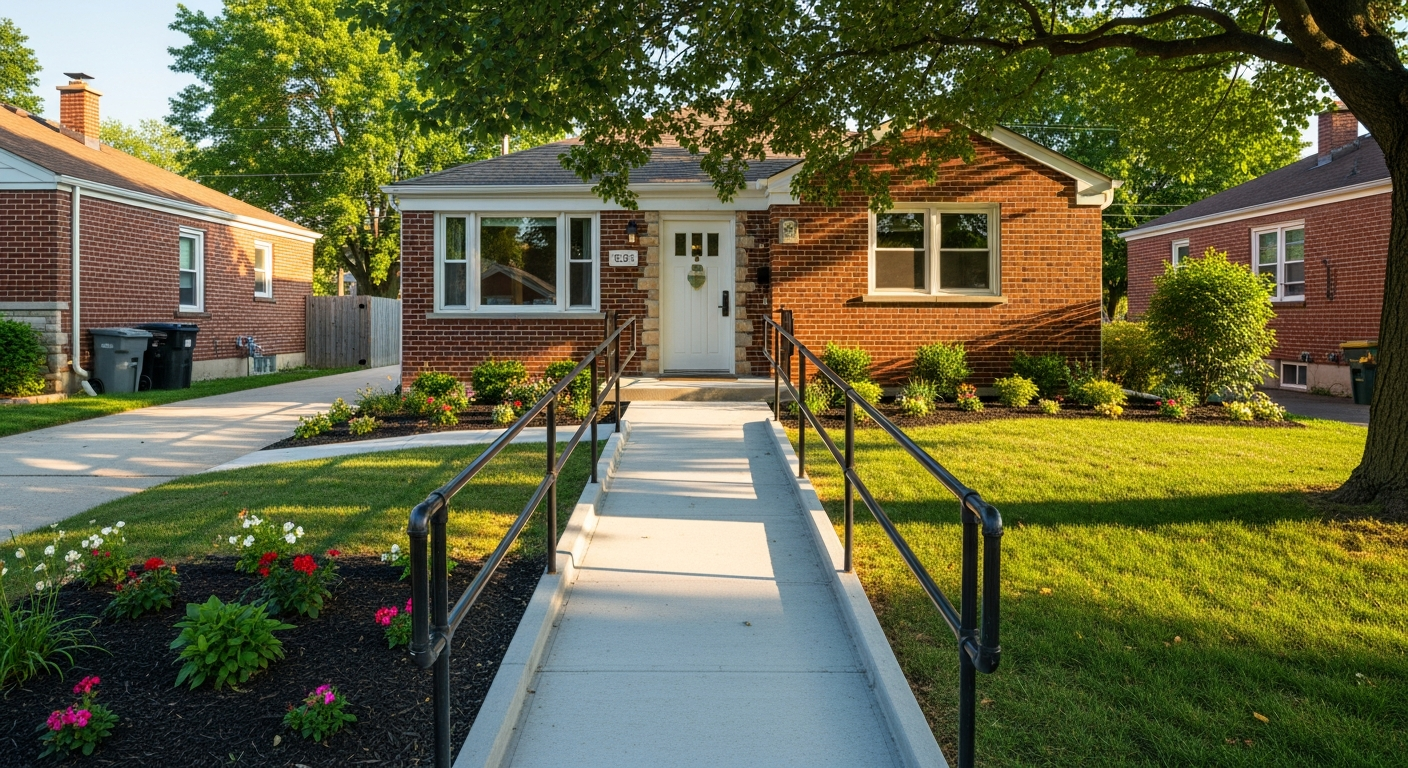
This model lines up almost perfectly with what the Pew data tells us seniors actually want — and with what the economics of the supply gap require.
The Price Gap Is One of the Most Powerful Demand Drivers in the Market
Cost is where the scattered-site thesis becomes almost impossible to argue against.
The CareScout 2025 Cost of Care Survey — with data collected July through November 2025 — reported the national median monthly cost of a nursing home semi-private room at $9,583 ($315 per day), up 2% year-over-year. A private room averaged $10,798 per month ($355 per day), up 1%.
Assisted living averages $4,500 to $6,000 per month nationally, with premium urban markets running $7,000 to $10,000+.
A well-operated scattered-site aging-in-place home with AI monitoring and coordinated part-time caregiving typically prices at $2,500 to $3,800 per month — roughly 40 cents on the dollar compared to assisted living, and less than a third of nursing home rates.
This is not a minor pricing differential. It is the kind of gap that permanently reshapes consumer behavior and creates lasting market share for operators who move first.
The value proposition becomes even more compelling when factoring in Medicare Advantage. Beginning in 2019 and expanding significantly through 2025, Medicare Advantage plans began covering supplemental benefits including in-home care services, home modifications, personal care aides, and remote monitoring technology. With more than 34 million Americans enrolled in Medicare Advantage, this policy shift has materially reduced the out-of-pocket cost of aging in place for a large and growing portion of the senior population — effectively expanding the financially accessible market for scattered-site operators through federal insurance policy.
Monthly Housing Cost Comparison: Senior Care Options (2025 National Medians)
CareScout 2025 Cost of Care Survey (data collected July–November 2025): semi-private nursing home at $9,583/month ($315/day, +2% YoY); private room at $10,798/month ($355/day, +1% YoY). A well-operated scattered-site senior home with AI monitoring delivers comparable safety at roughly one-third the nursing home cost — a price differential that permanently reshapes consumer behavior.
A nursing home semi-private room costs $9,583/month (CareScout 2025). A well-operated scattered-site home delivers comparable safety and oversight for $2,500–$3,800. That price gap drives permanent shifts in consumer behavior.
— CareScout 2025 Cost of Care Survey
Tech and AI Are Making Aging in Place Viable at Scale
The historical objection to aging in place at higher acuity levels has always been safety. What happens when someone falls and there is no on-site staff? What happens with medication adherence, cognitive decline, and emergency response?
Technology has answered that question with a precision that has fundamentally changed the risk calculus.
AI-powered fall detection systems now report accuracy rates above 99% — identifying falls in real time and automatically dispatching assistance without requiring the senior to press a button or call for help.
Remote patient monitoring platforms track vitals, movement patterns, sleep quality, bathroom frequency, and behavioral changes — creating baseline profiles for each resident and flagging anomalies before they become crises. A senior who stops walking their normal morning route, or who visits the bathroom significantly more at night, may be experiencing the early stages of a health event. AI systems catch these patterns days before clinical symptoms appear.
Smart medication dispensers with biometric verification ensure correct dosing without direct supervision, eliminating one of the primary causes of senior hospitalization and ER visits.
The operational economics are equally compelling. A single care coordinator using a modern AI monitoring platform can effectively oversee 15 to 20 scattered-site homes simultaneously — compared to the 1:5 or 1:8 staff-to-resident ratios required in traditional assisted living settings. This compression of labor cost per resident is the fundamental economic engine of the model.
NIC research indicates that operators deploying AI monitoring and care coordination technology are achieving 8–12% reductions in operating costs compared to traditionally staffed facilities, while simultaneously improving health outcomes and resident satisfaction scores.
The Modifications That Unlock the Model
Transforming a standard residential property into a premium aging-in-place asset requires targeted investment. The modifications are structural and functional — and they dramatically expand the pool of residents a property can serve.
Doorway widening to 36 inches or greater is the foundational modification. Standard residential doorways are typically 28 to 30 inches — insufficient for wheelchairs and walkers. Widening to ADA standards opens the property to the full spectrum of mobility needs.
Ingress and egress ramping eliminates the step barriers that render standard homes inaccessible. Per ADA Standards for Accessible Design: a maximum slope of 1:12, meaning one inch of rise per twelve inches of run. A well-designed ramped entryway maintains curb appeal while creating true zero-threshold access.
Hallway clearance of at least 36 inches, ideally 42 inches in high-traffic corridors, allows for wheelchair navigation without structural bottlenecks. Many pre-1990 homes require selective wall reconfiguration to achieve this clearance.
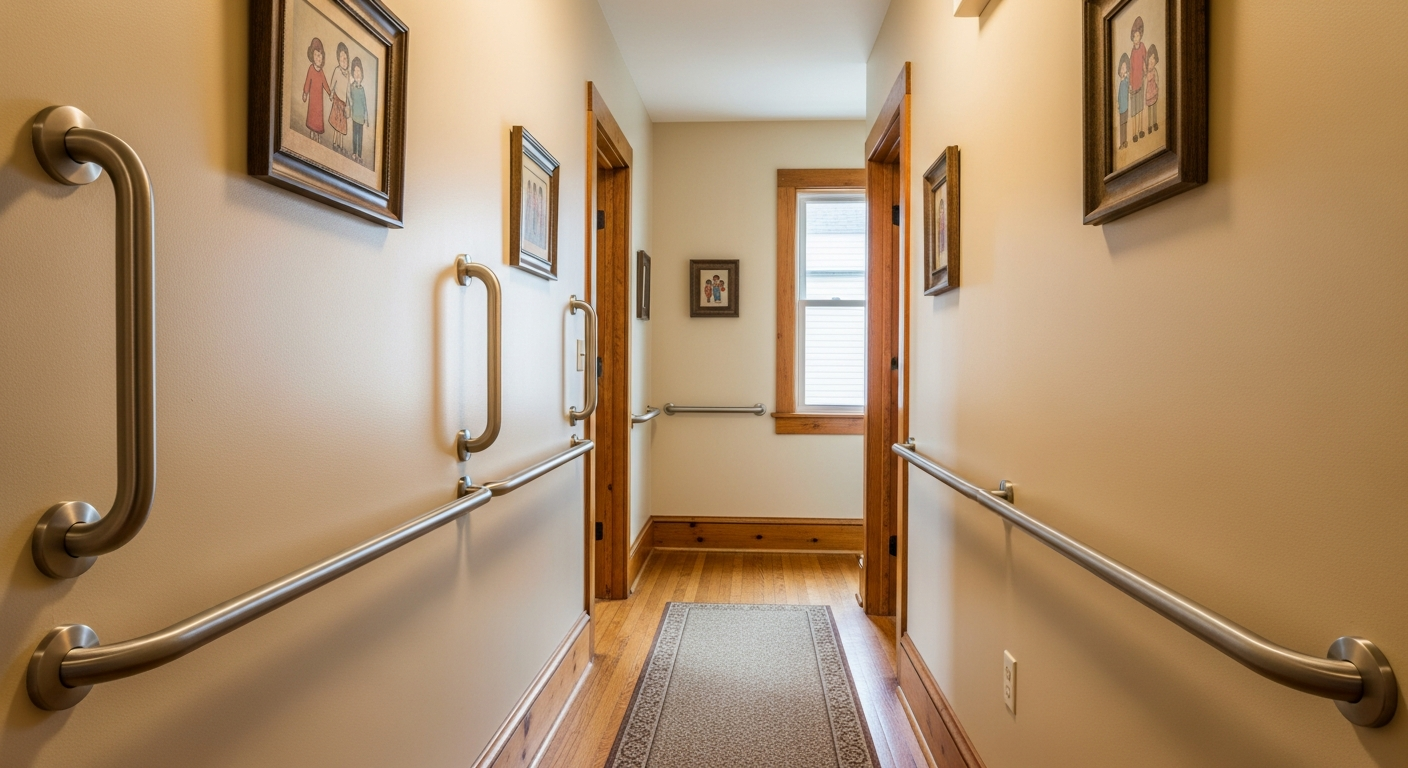
Bathroom conversion — roll-in showers with bench seating, ANSI-compliant grab bars at transfer and balance positions, comfort-height toilets, non-slip flooring — represents the single highest-value modification per square foot. Bathrooms are where the majority of senior falls occur.
Kitchen modifications, including lowered countertop sections, pull-out shelving, single-lever faucets, and lever-style hardware throughout, complete the core package.
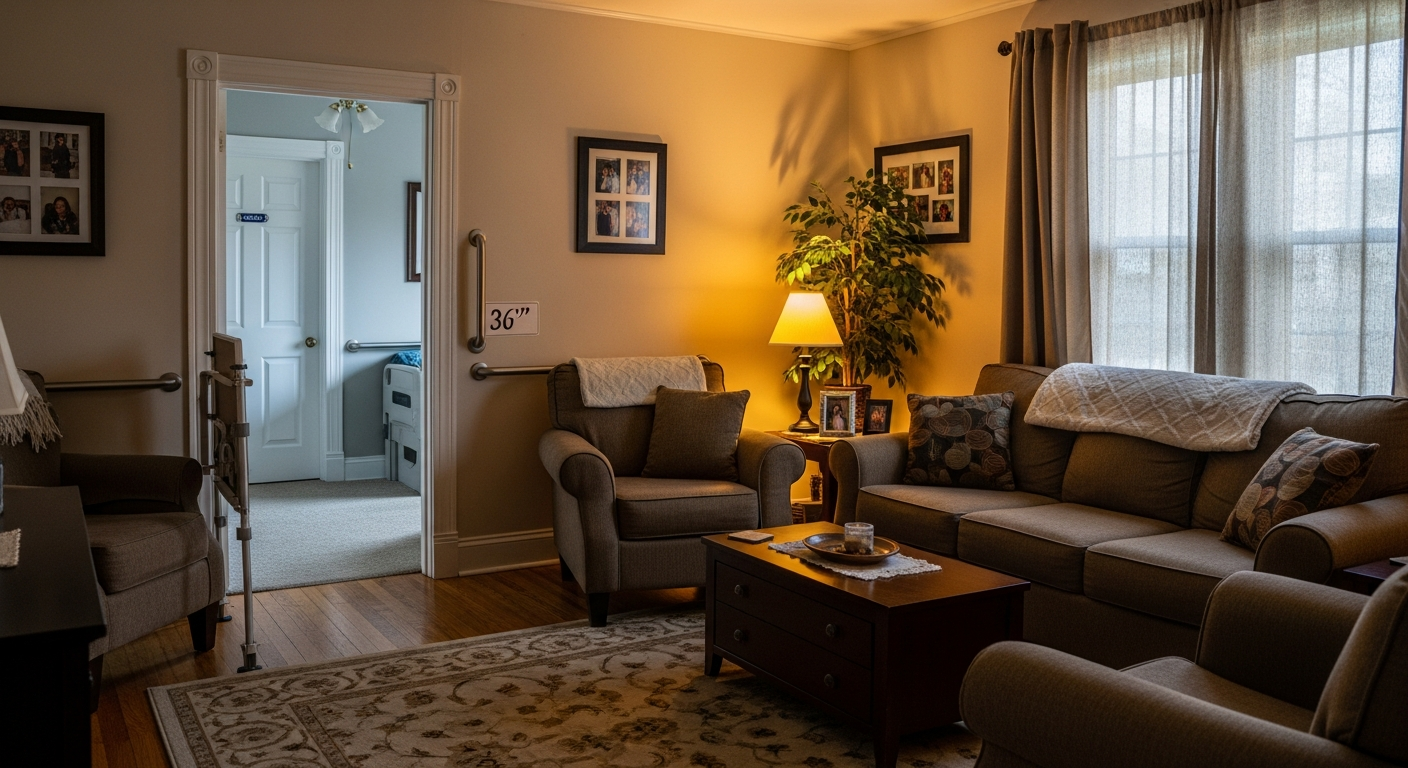
Smart home integration — voice-activated lighting, thermostats, locks, and appliances — allows residents to maintain independence without requiring fine motor dexterity, and rounds out the premium aging-in-place package.
The total cost of these modifications on a standard 1,500 to 2,000 square foot property typically runs $30,000 to $80,000, depending on starting condition and depth of modification. In strong Sun Belt markets, operators are achieving $400 to $800 per month rent premiums on modified properties compared to standard rentals, with lower vacancy and longer tenures.
The Geography of the Opportunity
Demand concentrates in markets with favorable climates, established retirement communities, strong healthcare infrastructure, and significant boomer in-migration.
The Sun Belt states — Arizona, Florida, Texas, Nevada, and the Carolinas — are experiencing the most acute demand-supply imbalance. Arizona's 65+ population grew 27% between 2015 and 2025. The Phoenix metro has become one of the most supply-constrained senior housing markets in the country — occupancy above 88% across all senior housing types, construction pipeline at historically low levels relative to incoming demand.
Secondary Sun Belt markets — Tucson, Sarasota, Chattanooga, Greenville, Henderson — offer the better opportunity for smaller operators today, where institutional capital has not yet fully priced the demographic tailwind and residential acquisition costs remain attractive.
Proximity to health systems matters enormously in site selection. Properties within 15 to 20 minutes of a hospital or integrated health campus have better emergency response outcomes, lower insurance premiums, and stronger family confidence — all of which translate to premium pricing and lower vacancy.
Why This Matters Right Now
The window for first-mover advantage in scattered-site senior housing is narrowing, but it has not closed.
Institutional capital is beginning to recognize what the demographic data has been signaling for years. NIC's Q2 2025 data shows 16 consecutive quarters of senior housing occupancy growth, with occupancy reaching 88.1% — a run of sustained demand that has no modern precedent in the asset class. Cap rates are compressing. The major REITs and private equity firms are actively building and acquiring at scale in the traditional facility-based model.
But the scattered-site, residential-scale model remains largely the domain of smaller operators, regional developers, and individual investors. There is no dominant national brand. There is no institutional standard-bearer that has figured out the operational model and is ready to franchise or rapidly scale. That is the opportunity.
An individual investor or small operator today can acquire residential properties in desirable neighborhoods, apply strategic modifications, deploy AI monitoring technology, build a care coordination model, and establish market presence before the large institutional players have completed their due diligence on the space.
This is precisely what the early multifamily investors who bought in 2010 understood: the asset class was right, the demographic tailwind was real, the operational models were still fragmented, and the window to acquire before price discovery was limited.
The scattered-site senior housing opportunity has the same structural profile — with one additional tailwind the 2010 multifamily wave did not have: the Pew behavioral preference data, the AI technology stack, and the Medicare Advantage policy environment are all aligning simultaneously, creating a window where the demand is quantified, the operational tools exist, and the competition has not yet consolidated.
The boomers are here. The $88.5 trillion is real. 2025 is the single biggest year for Americans turning 65 in history. The Pew data is unambiguous. The technology works. The supply is structurally insufficient. And the regulatory environment is, for the first time, fully aligned with aging in place as the dominant care model.
This is the biggest opportunity in residential real estate since 2008. And it is happening in the neighborhood next door.
The next great real estate opportunity is not in another country. It is not in a new asset class no one has heard of. It is happening right now, in residential neighborhoods across America, one aging household at a time.
Seventy-three million baby boomers are moving through their sixties and seventies. They built the most prosperous generation in American history. The Federal Reserve's Distributional Financial Accounts shows they currently hold $88.5 trillion in total wealth — 51.4% of all U.S. household wealth as of Q1 2025. And now, they are deciding where they want to spend the final chapter of their lives.
The answer, overwhelmingly, is: home.
The Preference Is Clear: Seniors Want to Stay Home
On February 26, 2026, the Pew Research Center published findings from a survey of 8,750 U.S. adults ages 65 and older who currently live at home without a caregiver. The survey was conducted September 2–8, 2025. The question was direct: if there came a time when you could no longer live independently, where would you prefer to live?
60% said their own home — with a caregiver. Only 18% said an assisted living facility. Only 1% said a nursing home.
This is not a niche preference. This is the dominant sentiment of an entire generation, confirmed by the most recent available data. And it is a sentiment the real estate industry is wildly underprepared to serve.
Think about what that means in structural terms. The senior housing industry has spent the last three decades building almost exclusively for the 18% who prefer assisted living and the 1% who prefer nursing homes. The 60% — the largest segment by a factor of more than three — have had almost nothing built to specifically serve their stated preference.
That is a market failure on a generational scale. And market failures of this magnitude tend to produce investment opportunities of corresponding size.
Where Seniors Would Prefer to Live If They Could No Longer Live Independently (%)
Pew Research Center published February 26, 2026. Survey of 8,750 U.S. adults ages 65+ conducted September 2–8, 2025. The data confirms the industry's fundamental misallocation: it has built aggressively for the 18% who prefer assisted living while the 60% who prefer to stay home have had almost nothing built specifically for them.
The industry has spent three decades building for the 18% who want assisted living. The 60% who want to stay home have had almost nothing built specifically for them. That is a market failure on a generational scale.
— Andrew LeBaron
The Wealth Transfer That Changes Everything
The numbers behind this demographic story are staggering.
Baby boomers — born between 1946 and 1964 — currently control $88.5 trillion in household wealth, per the Federal Reserve's Q1 2025 Distributional Financial Accounts release. That figure encompasses real estate equity, retirement accounts, investment portfolios, business interests, and personal savings accumulated across five decades of earning. It is the largest private wealth concentration by a single generation in American history — equivalent to 51.4% of every dollar of wealth owned by every household in the United States.
That wealth is now in motion.
As boomers age, their assets pass to Gen X and millennials through inheritance, inter-vivos gifting, trust distributions, and estate settlement. The children of the boomers are inheriting homes, portfolios, and in many cases, direct financial responsibility for their parents' care and housing decisions.
There are approximately 65 million Gen X adults and 72 million millennials in the United States. They are the primary recipients of this transfer, and they are making two categories of housing decisions with it: decisions about their own futures and decisions about where their parents will live. Both flow toward the same conclusion — home-based senior housing.
The implications for real estate are significant. Adult children who inherit assets or receive gifts are increasingly making care decisions for aging parents with meaningful capital behind them. They are willing to pay a premium for safety, dignity, and quality. The demand is not just demographic — it is financially backed by one of the largest wealth transfers in economic history.
$88.5 trillion. That is the current wealth held by baby boomers, per the Federal Reserve's Q1 2025 data. Wherever that capital lands, the housing decisions follow.
— Federal Reserve Distributional Financial Accounts, Q1 2025
Peak 65: The Most Important Demographic Year in U.S. History
The demographic arithmetic of 2025 is unlike anything the country has seen before.
2025 is the "Peak 65" year — the year with the highest number of Americans turning 65 in U.S. history. Approximately 11,400 Americans cross the age-65 threshold every single day, according to Alliance for Lifetime Income research. This surpasses the widely-cited but outdated "10,000 per day" figure; the actual 2025 pace is materially higher, and 2025 represents the absolute all-time peak.
This is not coincidental. The bulk of the baby boom occurred in the mid-to-late 1950s and early 1960s, meaning the largest single cohorts of boomers — the ones born in 1957, 1958, and 1959 — are crossing 65 in 2022–2024, and the peak concentrations follow. 2025 is the apex. The daily rate remains near-record through 2026 and 2027 before gradually easing.
Every person who will turn 65 through 2040 is already alive today. There is no uncertainty in this pipeline. It is a mathematical certainty written in census records.
What makes this moment even more compelling is what we know about longevity. According to the Social Security Administration's 2025 Trustees Report period life table, a 65-year-old woman has approximately 21 additional years of expected life; a man has approximately 18.5 years. A senior entering the market today at 65 is looking at a housing runway of nearly two decades. These are not transitional accommodations — they are long-duration residential commitments where quality, safety, and appropriateness of housing matters enormously over time.
The fastest-growing segment of the senior population is not the newly-minted 65-year-olds. It is the 85-and-older cohort, projected by the Census Bureau to more than double from approximately 7 million today to over 14 million by 2040. This oldest-old population has the most acute need for modified, care-enabled housing — and the least supply designed to serve it.
Think you know the facts behind the headlines?
6 questions · ~3 min
The Supply Crisis Is Not a Rumor: It Is a Number
The National Investment Center for Seniors Housing & Care tracks construction and delivery data across the senior housing sector with quarterly precision. The Q2 2025 numbers are stark.
The sector needs to deliver 90,000+ new senior housing units annually to keep pace with demographic demand. As of Q2 2025, fewer than 18,000 units were under construction nationally — the lowest level since Q1 2013, down 23% year-over-year, representing roughly 20% of the required pace.
The delivery numbers are even more alarming. In Q2 2025, the industry delivered approximately 800–809 new senior housing units — a figure that had never previously fallen below 1,000 in NIC's recorded history, and the lowest quarterly delivery since 2005.
The NIC MAP Vision Senior Housing Market Outlook Report projects the cumulative supply gap will reach $275 billion by 2030, representing a 550,000-unit shortfall at current development paces. The gap is not narrowing. It is widening.
On a positive note, NIC MAP Vision data shows senior housing occupancy has now hit 88.1% — the 16th consecutive quarter of improvement, a streak of sustained demand that has no modern precedent in the asset class. Rising occupancy with a collapsing supply pipeline is, for investors, a textbook setup.
For context: the math of demographics versus construction timelines means the supply deficit will compound for at least the next decade, regardless of what developers start building today. Ground-up senior housing construction takes 24–36 months from permit to certificate of occupancy. Scattered-site residential acquisition and modification takes 60–90 days. The speed advantage alone is a structural edge.
Senior Housing: Annual Units Needed vs. Current Pipeline (Q2 2025)
NIC MAP Vision Q2 2025 data: fewer than 18,000 units were under construction nationally — the lowest level since Q1 2013, down 23% year-over-year. Approximately 800–809 units were actually delivered in Q2 2025, a figure that had never previously fallen below 1,000 in NIC's recorded history. Against an annual need of 90,000+ units, the gap is not narrowing. It is widening.
809 new senior housing units were delivered in Q2 2025 — a figure that had never previously fallen below 1,000 in NIC's recorded history. The industry needs 90,000 units per year. That is not a gap. That is a canyon.
— NIC MAP Vision Q2 2025 Data
The Opportunity: Scattered-Site Residential Senior Housing
The traditional response to senior housing demand has been the Big Box model — large assisted living campuses and memory care facilities that house 150 to 400 residents under one roof. These are capital-intensive to develop ($200,000–$400,000+ per unit all-in), operationally complex, and increasingly misaligned with what seniors actually want.
The model gaining traction among a growing cohort of operators — and what I believe represents the biggest residential real estate opportunity since 2008 — is scattered-site senior housing.
The concept is operationally elegant: acquire standard single-family homes and small residential properties in desirable neighborhoods, make targeted ADA-compliant modifications, and operate them as premium aging-in-place residences with coordinated care services delivered by a central team.
Instead of one large facility with 200 beds, you operate 20 to 30 homes across a neighborhood, each housing two to four seniors, each maintaining its own character and community feel. The residents remain in a home environment. The operator delivers the services with an efficiency model made possible by AI monitoring technology.
This model lines up almost perfectly with what the Pew data tells us seniors actually want — and with what the economics of the supply gap require.
The Price Gap Is One of the Most Powerful Demand Drivers in the Market
Cost is where the scattered-site thesis becomes almost impossible to argue against.
The CareScout 2025 Cost of Care Survey — with data collected July through November 2025 — reported the national median monthly cost of a nursing home semi-private room at $9,583 ($315 per day), up 2% year-over-year. A private room averaged $10,798 per month ($355 per day), up 1%.
Assisted living averages $4,500 to $6,000 per month nationally, with premium urban markets running $7,000 to $10,000+.
A well-operated scattered-site aging-in-place home with AI monitoring and coordinated part-time caregiving typically prices at $2,500 to $3,800 per month — roughly 40 cents on the dollar compared to assisted living, and less than a third of nursing home rates.
This is not a minor pricing differential. It is the kind of gap that permanently reshapes consumer behavior and creates lasting market share for operators who move first.
The value proposition becomes even more compelling when factoring in Medicare Advantage. Beginning in 2019 and expanding significantly through 2025, Medicare Advantage plans began covering supplemental benefits including in-home care services, home modifications, personal care aides, and remote monitoring technology. With more than 34 million Americans enrolled in Medicare Advantage, this policy shift has materially reduced the out-of-pocket cost of aging in place for a large and growing portion of the senior population — effectively expanding the financially accessible market for scattered-site operators through federal insurance policy.
Monthly Housing Cost Comparison: Senior Care Options (2025 National Medians)
CareScout 2025 Cost of Care Survey (data collected July–November 2025): semi-private nursing home at $9,583/month ($315/day, +2% YoY); private room at $10,798/month ($355/day, +1% YoY). A well-operated scattered-site senior home with AI monitoring delivers comparable safety at roughly one-third the nursing home cost — a price differential that permanently reshapes consumer behavior.
A nursing home semi-private room costs $9,583/month (CareScout 2025). A well-operated scattered-site home delivers comparable safety and oversight for $2,500–$3,800. That price gap drives permanent shifts in consumer behavior.
— CareScout 2025 Cost of Care Survey
Tech and AI Are Making Aging in Place Viable at Scale
The historical objection to aging in place at higher acuity levels has always been safety. What happens when someone falls and there is no on-site staff? What happens with medication adherence, cognitive decline, and emergency response?
Technology has answered that question with a precision that has fundamentally changed the risk calculus.
AI-powered fall detection systems now report accuracy rates above 99% — identifying falls in real time and automatically dispatching assistance without requiring the senior to press a button or call for help.
Remote patient monitoring platforms track vitals, movement patterns, sleep quality, bathroom frequency, and behavioral changes — creating baseline profiles for each resident and flagging anomalies before they become crises. A senior who stops walking their normal morning route, or who visits the bathroom significantly more at night, may be experiencing the early stages of a health event. AI systems catch these patterns days before clinical symptoms appear.
Smart medication dispensers with biometric verification ensure correct dosing without direct supervision, eliminating one of the primary causes of senior hospitalization and ER visits.
The operational economics are equally compelling. A single care coordinator using a modern AI monitoring platform can effectively oversee 15 to 20 scattered-site homes simultaneously — compared to the 1:5 or 1:8 staff-to-resident ratios required in traditional assisted living settings. This compression of labor cost per resident is the fundamental economic engine of the model.
NIC research indicates that operators deploying AI monitoring and care coordination technology are achieving 8–12% reductions in operating costs compared to traditionally staffed facilities, while simultaneously improving health outcomes and resident satisfaction scores.
The Modifications That Unlock the Model
Transforming a standard residential property into a premium aging-in-place asset requires targeted investment. The modifications are structural and functional — and they dramatically expand the pool of residents a property can serve.
Doorway widening to 36 inches or greater is the foundational modification. Standard residential doorways are typically 28 to 30 inches — insufficient for wheelchairs and walkers. Widening to ADA standards opens the property to the full spectrum of mobility needs.
Ingress and egress ramping eliminates the step barriers that render standard homes inaccessible. Per ADA Standards for Accessible Design: a maximum slope of 1:12, meaning one inch of rise per twelve inches of run. A well-designed ramped entryway maintains curb appeal while creating true zero-threshold access.
Hallway clearance of at least 36 inches, ideally 42 inches in high-traffic corridors, allows for wheelchair navigation without structural bottlenecks. Many pre-1990 homes require selective wall reconfiguration to achieve this clearance.
Bathroom conversion — roll-in showers with bench seating, ANSI-compliant grab bars at transfer and balance positions, comfort-height toilets, non-slip flooring — represents the single highest-value modification per square foot. Bathrooms are where the majority of senior falls occur.
Kitchen modifications, including lowered countertop sections, pull-out shelving, single-lever faucets, and lever-style hardware throughout, complete the core package.
Smart home integration — voice-activated lighting, thermostats, locks, and appliances — allows residents to maintain independence without requiring fine motor dexterity, and rounds out the premium aging-in-place package.
The total cost of these modifications on a standard 1,500 to 2,000 square foot property typically runs $30,000 to $80,000, depending on starting condition and depth of modification. In strong Sun Belt markets, operators are achieving $400 to $800 per month rent premiums on modified properties compared to standard rentals, with lower vacancy and longer tenures.
The Geography of the Opportunity
Demand concentrates in markets with favorable climates, established retirement communities, strong healthcare infrastructure, and significant boomer in-migration.
The Sun Belt states — Arizona, Florida, Texas, Nevada, and the Carolinas — are experiencing the most acute demand-supply imbalance. Arizona's 65+ population grew 27% between 2015 and 2025. The Phoenix metro has become one of the most supply-constrained senior housing markets in the country — occupancy above 88% across all senior housing types, construction pipeline at historically low levels relative to incoming demand.
Secondary Sun Belt markets — Tucson, Sarasota, Chattanooga, Greenville, Henderson — offer the better opportunity for smaller operators today, where institutional capital has not yet fully priced the demographic tailwind and residential acquisition costs remain attractive.
Proximity to health systems matters enormously in site selection. Properties within 15 to 20 minutes of a hospital or integrated health campus have better emergency response outcomes, lower insurance premiums, and stronger family confidence — all of which translate to premium pricing and lower vacancy.
Why This Matters Right Now
The window for first-mover advantage in scattered-site senior housing is narrowing, but it has not closed.
Institutional capital is beginning to recognize what the demographic data has been signaling for years. NIC's Q2 2025 data shows 16 consecutive quarters of senior housing occupancy growth, with occupancy reaching 88.1% — a run of sustained demand that has no modern precedent in the asset class. Cap rates are compressing. The major REITs and private equity firms are actively building and acquiring at scale in the traditional facility-based model.
But the scattered-site, residential-scale model remains largely the domain of smaller operators, regional developers, and individual investors. There is no dominant national brand. There is no institutional standard-bearer that has figured out the operational model and is ready to franchise or rapidly scale. That is the opportunity.
An individual investor or small operator today can acquire residential properties in desirable neighborhoods, apply strategic modifications, deploy AI monitoring technology, build a care coordination model, and establish market presence before the large institutional players have completed their due diligence on the space.
This is precisely what the early multifamily investors who bought in 2010 understood: the asset class was right, the demographic tailwind was real, the operational models were still fragmented, and the window to acquire before price discovery was limited.
The scattered-site senior housing opportunity has the same structural profile — with one additional tailwind the 2010 multifamily wave did not have: the Pew behavioral preference data, the AI technology stack, and the Medicare Advantage policy environment are all aligning simultaneously, creating a window where the demand is quantified, the operational tools exist, and the competition has not yet consolidated.
The boomers are here. The $88.5 trillion is real. 2025 is the single biggest year for Americans turning 65 in history. The Pew data is unambiguous. The technology works. The supply is structurally insufficient. And the regulatory environment is, for the first time, fully aligned with aging in place as the dominant care model.
This is the biggest opportunity in residential real estate since 2008. And it is happening in the neighborhood next door.
Test Your Knowledge
How well do you know senior housing markets?

Andrew LeBaron