TL;DR
Q3 2025 senior housing occupancy reached 88.8%, marking the 14th consecutive quarter of growth and pushing the sector within striking distance of the 90% threshold that defines a healthy market. The industry now has 630,000 occupied units — an all-time high. Independent living crossed 90% for the first time since 2019. All 31 NIC MAP primary markets are above 80% occupancy, with Boston leading at 92.6%. Rent growth is accelerating: assisted living at +3.97% and independent living at +4.25% year-over-year. Industry projections point to 90-91% national occupancy by 2026, driven by the relentless demographic wave of aging baby boomers.
14 Consecutive Quarters: The Recovery That Kept Going
Fourteen consecutive quarters of occupancy growth. Let that sink in. Since the pandemic nadir in early 2022, senior housing has delivered uninterrupted recovery, absorbing every headwind the economy threw at it — rising interest rates, staffing shortages, inflation, construction cost spikes — and kept filling beds.
This consistency is what separates senior housing from cyclical asset classes. Office occupancy hasn't recovered. Retail is bifurcated. Even multifamily experienced supply-driven softness in several markets. Senior housing just kept climbing, quarter after quarter, because the demand driver — 73 million baby boomers aging into their late 70s and 80s — doesn't pause for economic cycles. The $275 billion supply gap we've been tracking only amplifies this occupancy momentum.
At F6 Partners, we've anchored our investment thesis on this demographic inevitability. The Q3 2025 data doesn't just validate that thesis — it strengthens it. With 630,000 occupied units representing an all-time high, the sector is absorbing every unit the market delivers and demanding more.

Senior Housing Occupancy Recovery (2019–2026)
Senior housing occupancy has mounted a remarkable recovery from pandemic lows, climbing for 13 straight quarters as the aging population drives relentless demand.
Independent Living Crosses 90%
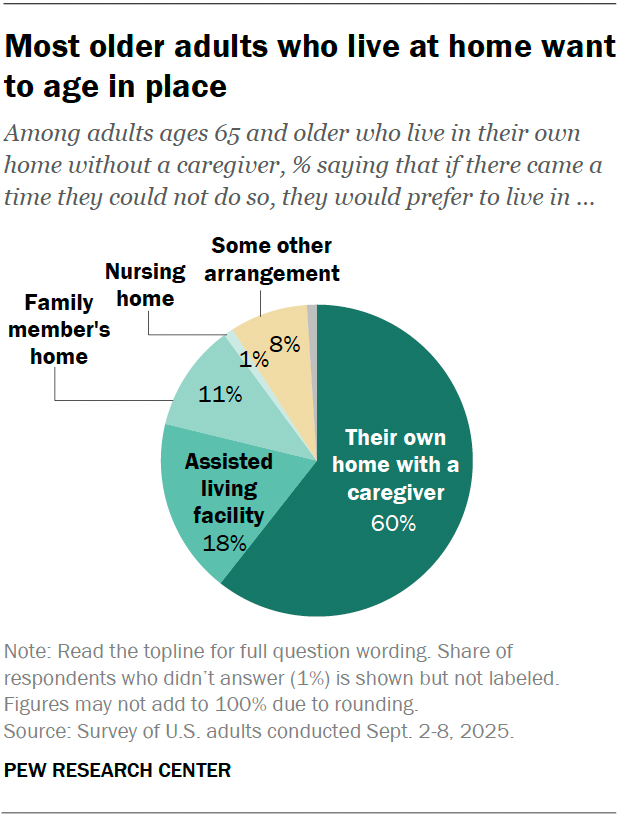
The independent living milestone deserves special attention. Crossing 90% occupancy for the first time since 2019 tells us something crucial about incoming resident preferences: baby boomers are choosing to move into communities while they're still healthy, active, and independent.
This is a fundamental shift from prior generations who often delayed the transition to senior housing until they needed assistance with daily living. Today's incoming residents want the social engagement, lifestyle amenities, and peace of mind that independent living offers — they're buying a lifestyle upgrade, not waiting for a medical necessity.
For operators and investors, this shift has profound implications — especially when combined with the solo ager demographic that nobody's planning for. Independent living residents stay longer, require fewer care resources, and generate more predictable revenue streams. Communities positioned as "lifestyle destinations" rather than "care facilities" are winning the competition for this affluent, discerning cohort.
Independent Living Occupancy (2019–2026)
Independent living occupancy is recovering faster than assisted living, driven by active baby boomers choosing lifestyle-oriented communities with resort-style amenities.
Think you know the facts behind the headlines?
5 questions · ~3 min
All 31 Markets Above 80%
Here's a statistic that demonstrates the breadth of this recovery: all 31 NIC MAP primary markets are now above 80% occupancy. Not most markets. Not the best markets. All of them. Boston leads at 92.6%, but even the weakest primary markets have cleared the threshold that signals functional demand in every geography.

This nationwide strength contradicts the narrative that senior housing recovery is concentrated in a few hot markets. The demographic wave is national in scope, and the supply constraints — limited construction, elevated development costs, regulatory barriers — are equally widespread.
At F6 Partners, we evaluate markets based on the depth of the over-80 population, the supply pipeline relative to demographic demand, and the quality of operating partners available. With all 31 primary markets above 80%, our investment universe has expanded, but we remain focused on markets where the occupancy trajectory points toward 93%+ because that's where the strongest pricing power resides.
Rent Growth Accelerating
The rent growth figures tell the operating story. Assisted living rents grew 3.97% year-over-year — well above general inflation — while independent living posted even stronger growth at 4.25%. Operators are gaining the confidence to push rates because they know demand will absorb the increases.
This pricing power is the direct result of the occupancy recovery. When communities are running at 88-90%+ occupancy, operators shift from competing for residents to selecting residents. Waitlists are forming at premium communities in top markets, and the pricing leverage that creates flows directly to revenue growth and net operating income expansion.
For investors, rent growth at these levels combined with stable-to-declining cap rates creates a compelling total return profile. Asset values appreciate as NOI grows, and the demographic tailwinds suggest this growth trajectory has years of runway ahead.
Senior Housing Rent Growth YoY (2019–2026)
Senior housing rent growth has accelerated as tightening supply and robust demand give operators significant pricing power for the first time in years.
The Path to 90-91% by 2026
Industry projections of 90-91% national occupancy by 2026 are not aspirational — they're mathematical. The 80-plus population is growing faster than the industry can build new units. With construction starts still depressed and development timelines stretching 24-36 months, the supply response can't arrive fast enough to prevent further occupancy gains.
At F6 Partners, we believe the senior housing sector is entering its strongest period in over a decade. The combination of demographic demand, supply constraints, technology-driven operational improvements, and stabilizing interest rates creates an investment opportunity that we're positioning aggressively to capture. For investors exploring co-investment strategies when LPs want a seat at the table, senior housing's predictable occupancy trajectory makes it an ideal co-investment candidate. Fourteen consecutive quarters of growth isn't the end of the story — it's the foundation for what comes next.
TL;DR
Q3 2025 senior housing occupancy reached 88.8%, marking the 14th consecutive quarter of growth and pushing the sector within striking distance of the 90% threshold that defines a healthy market. The industry now has 630,000 occupied units — an all-time high. Independent living crossed 90% for the first time since 2019. All 31 NIC MAP primary markets are above 80% occupancy, with Boston leading at 92.6%. Rent growth is accelerating: assisted living at +3.97% and independent living at +4.25% year-over-year. Industry projections point to 90-91% national occupancy by 2026, driven by the relentless demographic wave of aging baby boomers.
14 Consecutive Quarters: The Recovery That Kept Going
Fourteen consecutive quarters of occupancy growth. Let that sink in. Since the pandemic nadir in early 2022, senior housing has delivered uninterrupted recovery, absorbing every headwind the economy threw at it — rising interest rates, staffing shortages, inflation, construction cost spikes — and kept filling beds.
This consistency is what separates senior housing from cyclical asset classes. Office occupancy hasn't recovered. Retail is bifurcated. Even multifamily experienced supply-driven softness in several markets. Senior housing just kept climbing, quarter after quarter, because the demand driver — 73 million baby boomers aging into their late 70s and 80s — doesn't pause for economic cycles. The $275 billion supply gap we've been tracking only amplifies this occupancy momentum.
At F6 Partners, we've anchored our investment thesis on this demographic inevitability. The Q3 2025 data doesn't just validate that thesis — it strengthens it. With 630,000 occupied units representing an all-time high, the sector is absorbing every unit the market delivers and demanding more.
Senior Housing Occupancy Recovery (2019–2026)
Senior housing occupancy has mounted a remarkable recovery from pandemic lows, climbing for 13 straight quarters as the aging population drives relentless demand.
Independent Living Crosses 90%
The independent living milestone deserves special attention. Crossing 90% occupancy for the first time since 2019 tells us something crucial about incoming resident preferences: baby boomers are choosing to move into communities while they're still healthy, active, and independent.
This is a fundamental shift from prior generations who often delayed the transition to senior housing until they needed assistance with daily living. Today's incoming residents want the social engagement, lifestyle amenities, and peace of mind that independent living offers — they're buying a lifestyle upgrade, not waiting for a medical necessity.
For operators and investors, this shift has profound implications — especially when combined with the solo ager demographic that nobody's planning for. Independent living residents stay longer, require fewer care resources, and generate more predictable revenue streams. Communities positioned as "lifestyle destinations" rather than "care facilities" are winning the competition for this affluent, discerning cohort.
Independent Living Occupancy (2019–2026)
Independent living occupancy is recovering faster than assisted living, driven by active baby boomers choosing lifestyle-oriented communities with resort-style amenities.
Think you know the facts behind the headlines?
5 questions · ~3 min
All 31 Markets Above 80%
Here's a statistic that demonstrates the breadth of this recovery: all 31 NIC MAP primary markets are now above 80% occupancy. Not most markets. Not the best markets. All of them. Boston leads at 92.6%, but even the weakest primary markets have cleared the threshold that signals functional demand in every geography.
This nationwide strength contradicts the narrative that senior housing recovery is concentrated in a few hot markets. The demographic wave is national in scope, and the supply constraints — limited construction, elevated development costs, regulatory barriers — are equally widespread.
At F6 Partners, we evaluate markets based on the depth of the over-80 population, the supply pipeline relative to demographic demand, and the quality of operating partners available. With all 31 primary markets above 80%, our investment universe has expanded, but we remain focused on markets where the occupancy trajectory points toward 93%+ because that's where the strongest pricing power resides.
Rent Growth Accelerating
The rent growth figures tell the operating story. Assisted living rents grew 3.97% year-over-year — well above general inflation — while independent living posted even stronger growth at 4.25%. Operators are gaining the confidence to push rates because they know demand will absorb the increases.
This pricing power is the direct result of the occupancy recovery. When communities are running at 88-90%+ occupancy, operators shift from competing for residents to selecting residents. Waitlists are forming at premium communities in top markets, and the pricing leverage that creates flows directly to revenue growth and net operating income expansion.
For investors, rent growth at these levels combined with stable-to-declining cap rates creates a compelling total return profile. Asset values appreciate as NOI grows, and the demographic tailwinds suggest this growth trajectory has years of runway ahead.
Senior Housing Rent Growth YoY (2019–2026)
Senior housing rent growth has accelerated as tightening supply and robust demand give operators significant pricing power for the first time in years.
The Path to 90-91% by 2026
Industry projections of 90-91% national occupancy by 2026 are not aspirational — they're mathematical. The 80-plus population is growing faster than the industry can build new units. With construction starts still depressed and development timelines stretching 24-36 months, the supply response can't arrive fast enough to prevent further occupancy gains.
At F6 Partners, we believe the senior housing sector is entering its strongest period in over a decade. The combination of demographic demand, supply constraints, technology-driven operational improvements, and stabilizing interest rates creates an investment opportunity that we're positioning aggressively to capture. For investors exploring co-investment strategies when LPs want a seat at the table, senior housing's predictable occupancy trajectory makes it an ideal co-investment candidate. Fourteen consecutive quarters of growth isn't the end of the story — it's the foundation for what comes next.
Test Your Knowledge
How well do you know senior housing markets?

Andrew LeBaron